Elasticsearch Cluster Health: Green, Yellow, Red Explained
Elasticsearch Cluster Health: Green, Yellow, Red Explained
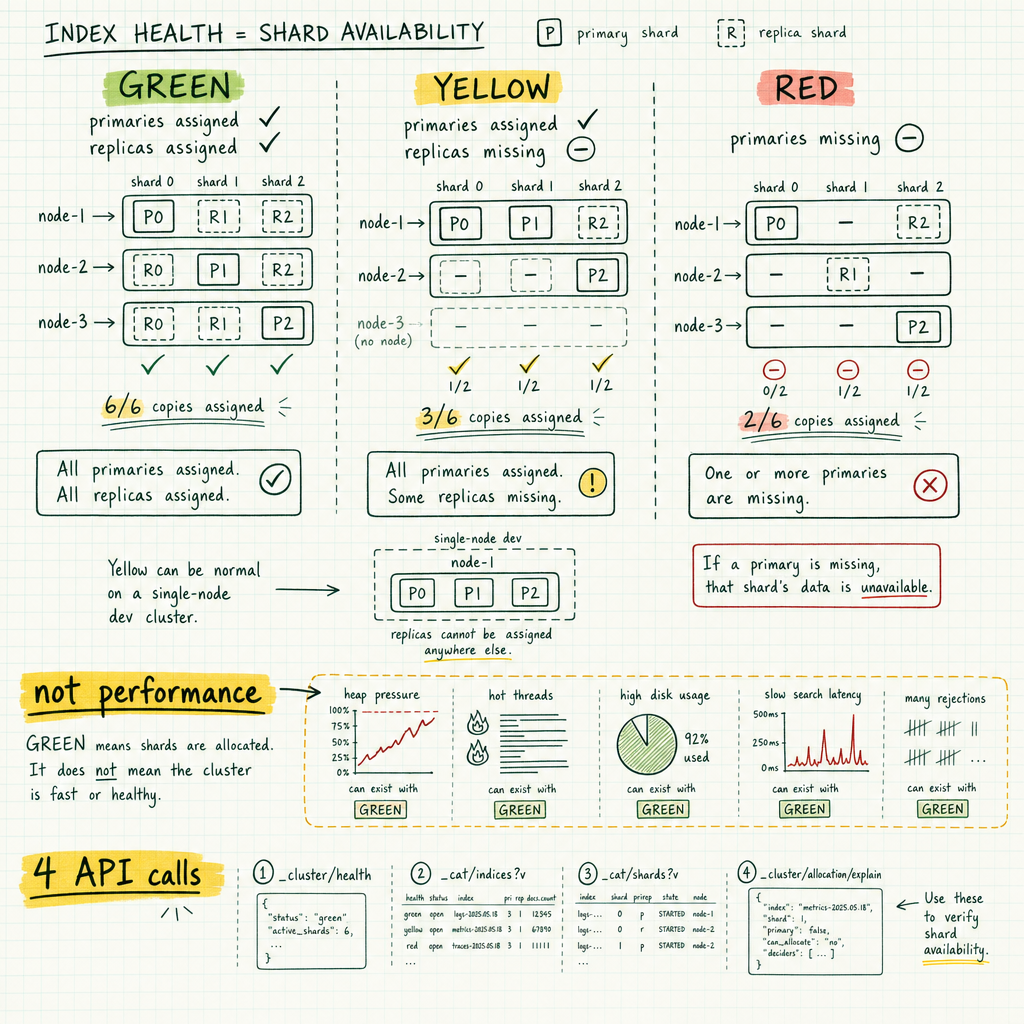
Green means every primary and replica shard is assigned. Yellow means every primary is assigned but at least one replica isn’t — data is fully available, you’ve just lost redundancy. Red means at least one primary is unassigned, and the documents on that shard can’t be searched or written to. That’s the whole traffic light. It says nothing about heap, disk, latency, or whether the master is drowning in pending tasks.
I got paged at 03:12 for a red cluster. Twelve minutes of adrenaline later I found the cause: logs-nginx-2024.11.03, a six-week-old index nobody had queried since the day it rolled over, sitting on a disk that had been reformatted during a node rebuild. One primary shard, gone. Nothing else in the cluster was affected. Search worked. Ingest worked. The write-path indices were all green. But cluster status is the worst index status, so the whole thing reported red, and my alerting rule did what I had told it to do.
The inverse bites harder. A few months earlier I watched a perfectly green cluster with a data node at 97% disk. Green, because every shard was assigned. Also about to have every index on that node flipped to read_only_allow_delete by the flood-stage watermark, at which point ingest would stop dead.
And on the other side: a single-node dev cluster running the production index template with number_of_replicas: 1 will be yellow forever, by design, and there is nothing to fix.
By the end of this you should be alerting on shard counts and index names, not on a colour.
What green, yellow and red actually mean
These are per-index statuses, and they’re entirely about shard assignment.
Green
All primary shards and all replica shards for the index are assigned to nodes.
Yellow
All primary shards are assigned. At least one replica shard is unassigned. Data is fully available for both reads and writes; you’ve just lost redundancy, and search throughput might dip slightly since replicas serve reads too.
Red
At least one primary shard is unassigned. The documents on that shard are unavailable for search, and indexing requests routed to it will fail. Everything else keeps working normally.
The cluster-level status is the worst status of any index in the cluster. One junk index makes the entire cluster report red. Remember that when you write your alert.
A red cluster is not a down cluster. It’s a cluster with a hole in it, and your first job is to find out what fell through.
Checking cluster health with the API
curl -s "http://localhost:9200/_cluster/health?pretty"In Kibana Dev Tools:
GET _cluster/healthA realistic response from the elasticsearch cluster health API, right after a node has been lost:
{
  "cluster_name": "search-prod-eu",
  "status": "yellow",
  "timed_out": false,
  "number_of_nodes": 5,
  "number_of_data_nodes": 3,
  "active_primary_shards": 214,
  "active_shards": 401,
  "relocating_shards": 2,
  "initializing_shards": 4,
  "unassigned_shards": 27,
  "delayed_unassigned_shards": 21,
  "number_of_pending_tasks": 0,
  "task_max_waiting_in_queue_millis": 0,
  "active_shards_percent_as_number": 92.61
}
Reading the fields that matter
status is the rollup you already understand. number_of_nodes counts everything including masters and coordinating nodes; number_of_data_nodes is the one that constrains allocation, because only data nodes hold shards. If those two diverge unexpectedly, a node left.
active_primary_shards versus active_shards gives you the effective replica factor across the cluster. Here, 401 total against 214 primaries means most indices have one replica and some have none.
relocating_shards and initializing_shards are transient work. Non-zero is normal during a rebalance, a rolling restart, or right after an index is created. Non-zero for an hour is not normal.
unassigned_shards is the number that produced the colour. delayed_unassigned_shards is the subset Elasticsearch is deliberately holding back, waiting for a node to come home. That distinction is the single most useful thing in this response: 21 of the 27 unassigned shards are delayed, which means the cluster expects a node to return and isn’t yet copying data. Don’t panic, and don’t restart anything else.
number_of_pending_tasks and task_max_waiting_in_queue_millis describe the master’s cluster-state queue. Both climbing means the master is struggling, usually from too many shards or too many mapping updates.
active_shards_percent_as_number is what belongs on your dashboard. It degrades gracefully. A colour is a step function; 92.61% falling to 88% tells you a story that “yellow” cannot.
Graph these three together: unassigned_shards, initializing_shards, relocating_shards. Recovery looks like unassigned falling while initializing rises then falls. A stuck cluster looks like unassigned flat and initializing at zero.
Narrowing down with level=indices and level=shards
On a cluster with 900 indices, “red” isn’t an actionable statement. Narrow it:
curl -s "http://localhost:9200/_cluster/health?level=indices&pretty" \
  | jq '.indices | to_entries | map(select(.value.status != "green")) | from_entries'
Without jq, use filter_path to keep the response small:
GET _cluster/health?level=indices&filter_path=indices.*.status,indices.*.unassigned_shardsOnce you know the index, go one level deeper:
GET _cluster/health/logs-app-000042?level=shardsThat gives you per-shard status, including which shard number is unassigned. Be careful with level=shards at cluster scope — on a large cluster the response is enormous and you’re asking the master to serialise it. For anything beyond one index, use _cat/shards with filters instead.
Finding unassigned shards with _cat/shards
This is the workhorse call for unassigned shards in Elasticsearch.
curl -s "http://localhost:9200/_cat/shards?v&h=index,shard,prirep,state,unassigned.reason,unassigned.at,node&s=state"index shard prirep state unassigned.reason unassigned.at node
logs-app-000042 0 p STARTED es-data-2
logs-app-000042 0 r UNASSIGNED NODE_LEFT 2026-08-04T02:58:11.402Z
logs-app-000042 1 p STARTED es-data-1
logs-app-000042 1 r UNASSIGNED NODE_LEFT 2026-08-04T02:58:11.402Z
products-v7 0 p STARTED es-data-1
products-v7 0 r STARTED es-data-3To see only the broken ones:
curl -s "http://localhost:9200/_cat/shards?v&h=index,shard,prirep,state,unassigned.reason&s=index" \
  | grep UNASSIGNED
Reading the unassigned.reason field
| Reason | What it means | Your move |
|---|---|---|
INDEX_CREATED |
Index was just created, shards not placed yet | Wait seconds |
CLUSTER_RECOVERED |
Full cluster restart in progress | Wait, watch initializing_shards |
INDEX_REOPENED |
A closed index was reopened | Wait |
NODE_LEFT |
The node holding this copy disappeared | On replicas: wait out the delayed timeout. On primaries: real work |
ALLOCATION_FAILED |
Allocation was attempted and threw | Read the logs, then allocation/explain |
REPLICA_ADDED |
You just raised number_of_replicas |
Wait, or check capacity |
DANGLING_INDEX_IMPORTED |
An orphaned index dir was picked up | Usually delete it |
NEW_INDEX_RESTORED / EXISTING_INDEX_RESTORED |
Snapshot restore in flight | Wait |
PRIMARY_FAILED |
The primary failed after the replica was already initialising | Investigate immediately |
REROUTE_CANCELLED, REINITIALIZED, REALLOCATED_REPLICA, FORCED_EMPTY_PRIMARY, MANUAL_ALLOCATION |
Someone or something moved shards by hand | Ask who |
The core read: NODE_LEFT on replicas means delayed allocation is doing exactly what it was built for. ALLOCATION_FAILED or PRIMARY_FAILED on a primary means you have work to do right now.
That delay is index.unassigned.node_left.delayed_timeout, default 1m. It exists because copying a 40GB shard across the network to satisfy an SLA is expensive and pointless when the node is simply rebooting after a kernel patch. During the delay the shard shows up in delayed_unassigned_shards. If your nodes routinely take four minutes to restart, raise it:
PUT /logs-*/_settings
{ "settings": { "index.unassigned.node_left.delayed_timeout": "5m" } }
Diagnosing with _cluster/allocation/explain
The most useful and least used API in Elasticsearch. It asks the allocation machinery directly: why is this shard not placed? Read the response like a Postgres EXPLAIN: the headline is can_allocate, and the real answer lives in the per-node deciders underneath it.
With an empty body it explains an arbitrary currently-unassigned shard, which is perfect when you just want to know what’s wrong:
curl -s -XPOST "http://localhost:9200/_cluster/allocation/explain?pretty" \
  -H 'Content-Type: application/json' -d '{}'
Targeted:
POST _cluster/allocation/explain
{
  "index": "logs-app-000042",
  "shard": 0,
  "primary": false
}
Reading the deciders
A decider is a pluggable rule that votes on whether a shard may go on a node. Each returns YES, NO or THROTTLE with a text explanation. Allocation happens only if every decider says yes. A real response usually walks through several candidate nodes, each failing for its own reason:
{
  "index": "logs-app-000042",
  "shard": 0,
  "primary": false,
  "current_state": "unassigned",
  "unassigned_info": { "reason": "NODE_LEFT", "at": "2026-08-04T02:58:11.402Z" },
  "can_allocate": "no",
  "allocate_explanation": "cannot allocate because allocation is not permitted to any of the nodes",
  "node_allocation_decisions": [
    {
      "node_name": "es-data-2",
      "node_decision": "no",
      "deciders": [
        {
          "decider": "same_shard",
          "decision": "NO",
          "explanation": "a copy of this shard is already allocated to this node [[logs-app-000042][0], node[abc123], [P], s[STARTED]]"
        }
      ]
    },
    {
      "node_name": "es-data-3",
      "node_decision": "no",
      "deciders": [
        {
          "decider": "disk_threshold",
          "decision": "NO",
          "explanation": "the node is above the high watermark cluster setting [cluster.routing.allocation.disk.watermark.high=90%], having less than the minimum required free space, actual free: [8.1%]"
        }
      ]
    }
  ]
}
Two independent deciders, two independent problems, in one call: es-data-2 is disqualified by same_shard because it already holds the primary, and es-data-3 is disqualified by disk pressure. This is exactly why “yellow” on its own is useless — the fix for one node is “nothing to do,” and the fix for the other is “free disk space.”
Disk watermarks
The three watermark defaults, memorise them: low 85% (no new shards placed here), high 90% (Elasticsearch tries to move shards off), flood stage 95% (an index.blocks.read_only_allow_delete block is applied to indices with shards on that node). On recent versions the block releases automatically once usage drops below the high watermark. On older versions you had to clear it by hand, and plenty of clusters in the wild still behave that way.
Allocation filtering, abbreviated:
{
  "decider": "filter",
  "decision": "NO",
  "explanation": "node does not match index setting [index.routing.allocation.require] filters [data_tier:\"warm\"]"
}
Same family: shard allocation awareness via cluster.routing.allocation.awareness.attributes. If you declared three zones and only two are online, replicas that belong in the third zone stay unassigned and the cluster stays yellow, correctly.
Fixing Elasticsearch yellow status
Ranked by how often I actually see each cause.
1. Single node, replicas above zero. Expected. Confirm with allocation/explain showing same_shard. Fix by accepting it, or:
PUT /my-index/_settings
{ "index.number_of_replicas": 0 }
number_of_replicas is dynamic and takes effect immediately.
2. Replicas exceed the nodes available to that shard, including awareness zones. Check _cat/nodes node count against _cat/indices?v&h=index,rep. Either add nodes or reduce replicas.
3. A node just left and the delayed timeout hasn’t expired. Check delayed_unassigned_shards in _cluster/health. Wait. Bring the node back.
4. High watermark blocking allocation. Check _cat/allocation?v. Free space, or temporarily raise the watermark and then put it back.
5. Allocation filtering or attribute mismatch after a rolling upgrade or tier migration. Someone changed a node’s node.attr.* or an ILM policy moved indices to a tier with no nodes. allocation/explain shows the filter decider. Fix the attribute or the index setting.
Fixing Elasticsearch red cluster status
Step 1. Find out which indices, and decide whether you care.
curl -s "http://localhost:9200/_cat/indices?v&health=red&h=index,health,pri,rep,docs.count,store.size"A red .ds-logs-...-000031 backing index from three months ago is a ticket. A red primary on your current write index is a page. Make that judgment before you touch anything.
Step 2. Explain the primary.
POST _cluster/allocation/explain
{ "index": "<the red index>", "shard": 0, "primary": true }
Step 3. Is a node simply missing? Compare number_of_data_nodes to what you expect. If a node is down, start it. Shards come back. Most red clusters I’ve seen resolved themselves the moment a node rejoined.
Step 4. Disk. _cat/allocation?v shows per-node disk.percent. Free space or raise watermarks temporarily. If flood stage tripped, confirm the read_only_allow_delete block is gone once disk recovers; on older clusters clear it explicitly:
PUT /_all/_settings
{ "index.blocks.read_only_allow_delete": null }
Step 5. Last resorts only. If allocation hit index.allocation.max_retries (default 5) because of a transient fault you’ve since fixed:
POST _cluster/reroute?retry_failed=trueBeyond that sit allocate_stale_primary and allocate_empty_primary. Both require "accept_data_loss": true. The first promotes an out-of-date shard copy. The second creates an empty primary, discarding every document on that shard permanently.
Warning.
allocate_empty_primarydestroys data. It doesn’t recover anything — it makes the cluster green by declaring the missing documents to be nothing. Never run it because a blog post said to. Run it only after you’ve confirmed no other copy exists, you understand exactly which documents are gone, and you have a written plan to re-ingest them.
Using wait_for_status as a deployment gate
Where the health API genuinely shines is automation. It can block until a condition holds.
In a container entrypoint or a CI job:
curl -sf "http://es:9200/_cluster/health?wait_for_status=yellow&timeout=50s"Yellow is usually the right gate for CI. A single-node test cluster will never reach green if your index template sets replicas.
During a rolling restart, wait for the cluster to settle before touching the next node:
curl -s "http://es:9200/_cluster/health?wait_for_no_relocating_shards=true&wait_for_no_initializing_shards=true&timeout=10m"And to confirm the cluster has formed:
curl -s "http://es:9200/_cluster/health?wait_for_nodes=>=3&timeout=2m"wait_for_active_shards is available too.
The gotcha: the default timeout is 30s, and when a wait_for_* condition isn’t met in time, the response body contains "timed_out": true and the API returns HTTP 408 by default. A script that only checks the exit code of curl -f will fail on timeout (fine), but a script that parses .status from a 200 and ignores everything else will silently accept a timed-out response in setups that suppress the 408. Check the body:
resp=$(curl -s "http://es:9200/_cluster/health?wait_for_status=yellow&timeout=60s")
if [ "$(echo "$resp" | jq -r .timed_out)" != "false" ]; then
  echo "cluster did not reach yellow in time: $resp" >&2
  exit 1
fi
What green doesn’t tell you
Green is silent on: JVM heap pressure and GC pauses. Search and write rejections in thread pool queues. Hot spots from one 300GB shard sitting next to twenty 2GB ones. Disk headroom, right up until flood stage. Cluster-wide read-only blocks that someone set manually. A master whose pending task queue is growing.
The companion calls, all worth putting in your runbook:
curl -s "http://localhost:9200/_cat/nodes?v&h=name,node.role,heap.percent,ram.percent,cpu,load_1m"
curl -s "http://localhost:9200/_cat/thread_pool?v&h=node_name,name,active,queue,rejected&s=rejected:desc"
curl -s "http://localhost:9200/_cat/allocation?v"
curl -s "http://localhost:9200/_nodes/hot_threads"
curl -s "http://localhost:9200/_cluster/pending_tasks?pretty"
Sustained rejected in the write or search thread pool is a user-visible outage that the traffic light will happily report as green.
The Postgres DBA’s translation table
If you came from Postgres and inherited a search tier, here’s the mapping that made it click for me.
Yellow is a disconnected streaming standby. Your primary is up and taking writes. pg_stat_replication has lost a row. Nothing is broken for users. Your redundancy is gone, and if the primary dies now you have a problem. You’d open a ticket. You wouldn’t wake anyone.
Red is a tablespace whose files are missing. The rest of the database answers queries normally. Anything that touches that tablespace errors out. The blast radius is bounded and specific, which is why “which index?” is the first triage question in both worlds.
Green is pg_stat_replication showing every standby streaming with tiny lag. Comforting. Also completely silent about table bloat, a three-hour idle-in-transaction session pinning the xmin horizon, an autovacuum that’s been starved for a week, or a datfrozenxid marching toward wraparound.
Same lesson in both engines: replication and allocation status describe availability of copies. They don’t describe health. In Postgres you learned to monitor bloat, xact age and long transactions separately from replication lag. In Elasticsearch you monitor heap, thread pool rejections and disk separately from cluster status. The colour is one input among several.
unassigned_shards is closer to pg_stat_replication row count than to any single health number. It’s a count of missing copies, and counts are what you alert on.
What to actually alert on
Here’s the opinionated part.
Delete your “cluster status != green” alert. It fires for a dev cluster that’s yellow by design, for every index creation on a busy cluster, for every rolling restart, and for a dead logs index from November. It trains people to acknowledge and move on, which is exactly the failure mode you can’t afford at 3am.
Replace it with these:
Page: status == red sustained for more than 2 minutes, filtered to indices matching your write-path pattern. Get the index names into the alert body. GET _cluster/health?level=indices gives you per-index status; evaluate the rule against that, not the cluster rollup.
Ticket, don’t page: cluster status yellow persisting more than 15 minutes. Fifteen minutes comfortably outstrips the default 1m delayed timeout plus a normal node restart.
Page: unassigned_shards > 0 sustained well past your delayed_timeout, with delayed_unassigned_shards subtracted out. That’s a shard that can’t be placed, which is a decider saying no, which is a capacity or configuration problem that won’t self-heal.
Page: any index carrying index.blocks.read_only_allow_delete. Ingest is stopped for that index. This is a genuine outage regardless of the colour.
Page: thread pool rejected increasing on write or search.
Graph, don’t alert: active_shards_percent_as_number, plus the trio of unassigned/initializing/relocating. These are for the human who’s already been woken and needs to know whether recovery is progressing.
The one-liner to paste at the top of your runbook, the thing you run before anything else:
curl -s "http://localhost:9200/_cluster/health?level=indices" \
  | jq -r '.indices | to_entries[] | select(.value.status!="green")
           | "\(.value.status)\t\(.key)\tunassigned=\(.value.unassigned_shards)"' \
  | sort
Three seconds, and you know whether you’re looking at a dead logs index or a hole in the write path. That distinction is the whole job. The colour never told you which one you had.