Elasticsearch Heap Size: The 50% Rule and 31GB Ceiling
Elasticsearch Heap Size: Two Hard Ceilings and One Soft Variable
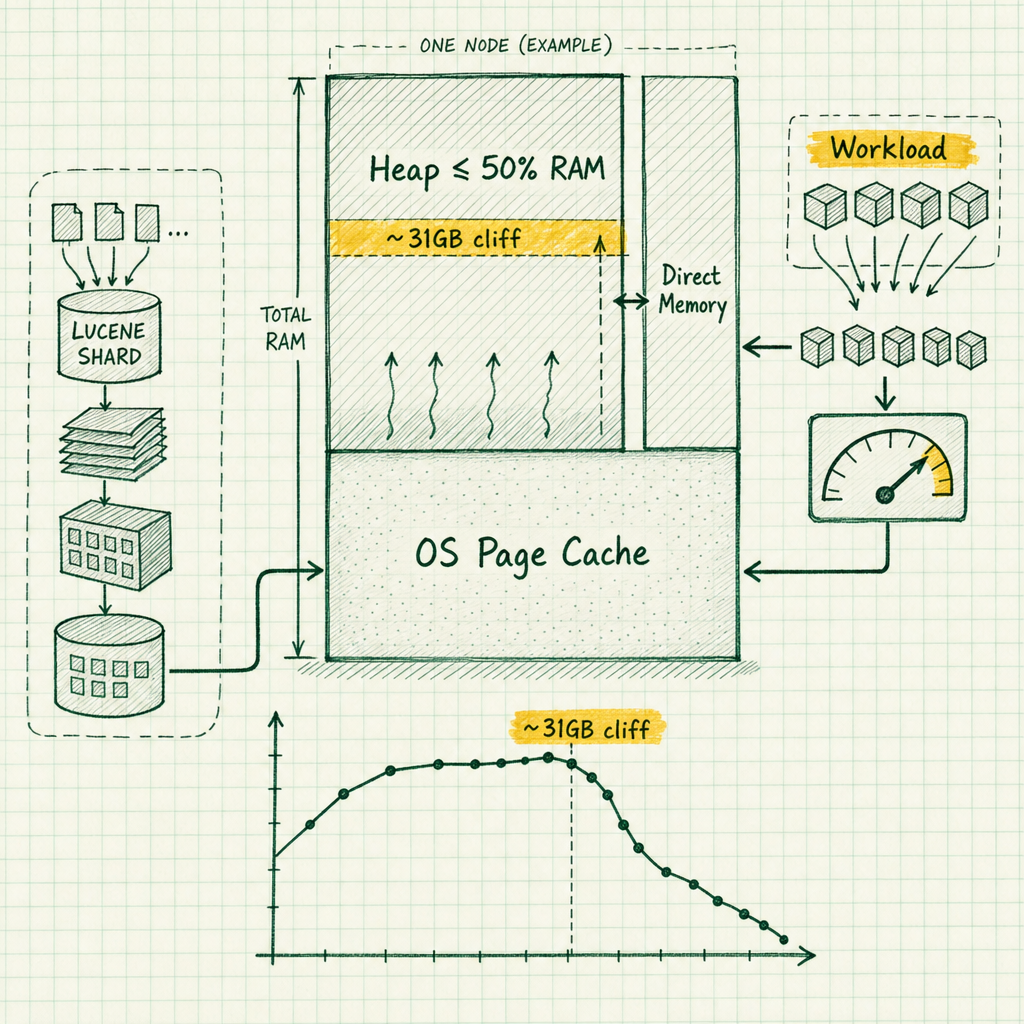
Short answer: set Elasticsearch heap to whichever is smaller — 50% of the machine’s RAM, or the compressed-oops-safe value just under 32GB (usually 26–30GB). Set Xms equal to Xmx, verify it, and stop there. Everything past that is shard and query tuning, not heap sizing.
The two ceilings nobody tells you about until it’s 3am
I’ve been paged for “Elasticsearch heap problems” something like thirty times. Twice it was a genuine sizing issue. The other twenty-eight, someone had asked a node to carry more work than any heap could carry, and the graph that woke them up was just the symptom showing itself.
So let’s dispatch the sizing question first, because it’s the easy half. Two hard ceilings govern elasticsearch heap size:
- No more than 50% of the machine’s physical RAM.
- Stay below the compressed ordinary object pointer threshold. 26GB is safe everywhere. 30GB works on most systems. Verify rather than guess.
Take the lower of the two. That’s your heap. No third rule, no per-workload multiplier, no “we do heavy aggregations so we need 48GB.” Once you’ve cleared both ceilings, everything else is workload shaping: shard count, mapping design, aggregation shape, fielddata, bulk sizing.
If you’re coming from Postgres, the architecture argument will feel familiar. We size shared_buffers at roughly 25% of RAM not because Postgres can’t use more, but because it reads through the OS page cache, and double-buffering the same blocks in two places wastes memory the kernel would manage better on its own. Elasticsearch runs the same play for higher stakes: Lucene’s segment files are memory-mapped, and the filesystem cache carries the primary serving path for index data, not some backup mechanism. Give the JVM half, give the kernel half. Different engine, same reflex.
That’s the last time I’ll lean on Postgres for comparison. The two systems diverge quickly from here.
Why the 50% rule exists: Lucene lives outside the heap
The JVM heap on an Elasticsearch node holds cluster state, query and aggregation working memory, indexing buffers, the request and query caches, network buffers before they’re pinned, and the object graph for everything currently in flight. What it mostly does not hold is your index.
Lucene segment files come through memory-mapped I/O. When a query needs a postings list, the JVM touches a mapped address, the kernel serves it from page cache or faults it in from disk, and that memory sits outside Xmx entirely. Doc values — the columnar structures backing sorting, aggregations on keyword and numeric fields, and script access — are read the same way. Since 7.3, the terms index (the FST mapping a term to its dictionary location) also lives off-heap and reads via mmap. That single change cut per-shard heap requirements substantially versus earlier versions, which is why heap advice written for Elasticsearch 5.x sounds far more anxious than it needs to today.
The consequence is direct. Every gigabyte handed to the JVM is a gigabyte the kernel can’t use to cache segment files. On a node whose working set exceeds RAM, moving 8GB from page cache to heap converts cached reads into disk reads: a search that would’ve been served from cached segment pages in microseconds now faults those pages back in from disk, and you feel it in the p99 before you feel it anywhere else. I’ve watched search latency get worse after a heap increase more than once. The mechanism was always this one.
The 31GB heap limit: compressed oops in Elasticsearch
Here’s the second ceiling, and it’s the one people get wrong most confidently.
On a 64-bit HotSpot JVM, every object reference is nominally 64 bits — a lot of overhead for a workload that allocates enormous numbers of small objects. So HotSpot uses compressed oops: it stores references as 32-bit values, treating them as offsets into the heap rather than absolute addresses. Because the JVM aligns objects on 8-byte boundaries by default, the low three bits of every address are always zero, so a 32-bit offset can address 2^32 × 8 bytes — 32GB. Cutting every reference from 8 bytes to 4 bytes saves memory and reduces cache pressure at the same time, which improves throughput across the board. That’s why the setting is on by default and worth protecting.
Above that boundary, compressed oops stop working and references widen back to 64 bits. Every reference in the object graph doubles — cluster state, cache keys, aggregation buckets, all of it.
The counterintuitive result follows directly: a heap configured slightly above the cutoff can hold less live data than one configured just below it. You paid for 33GB and got worse capacity than 30GB, plus longer GC pauses over a larger region. This is the single most reliable way to make an Elasticsearch node slower by giving it more memory.
Elastic’s own guidance is to keep Xmx below the compressed-oops cutoff, noting the exact threshold varies and that 26GB is safe on most systems while 30GB works on some. I want to be precise about the uncertainty here, because plenty of blog posts state “31744m” as though it were a constant. It isn’t. The cutoff depends on the JVM version, the platform, and where the heap base address lands. Check it rather than trust a number you read somewhere.
On JDK 9 and later (which includes the bundled JDK shipped with Elasticsearch 8.x):
java -Xmx30g -Xlog:gc+heap+coops=info -versionYou want a line reporting the heap address range and either “Compressed Oops mode: Zero based” or “Non-zero disjoint base.” Zero-based is the fastest variant, since it needs no base-address addition. If the line says compressed oops are disabled, your heap is over the line for that JVM on that machine.
On JDK 8, if you’re still maintaining a 7.x cluster:
java -Xmx30g -XX:+UnlockDiagnosticVMOptions -XX:+PrintCompressedOopsMode -versionRun it with the exact heap value you intend to configure, on the exact host and JDK. Then bisect if you want the last gigabyte. Honestly, on a 64GB box, the difference between 26GB and 30GB of heap almost never decides whether your cluster is stable. Take 26GB or 30GB, confirm zero-based mode, and spend your afternoon on shard counts instead.
Heap is not the whole memory budget
Xmx sets a floor for how much memory the process will consume, not a ceiling — the JVM needs more than that number to run. Specifically:
- Direct / NIO memory. Elasticsearch’s JVM ergonomics set
MaxDirectMemorySizeto half the configured max heap when you don’t specify it. A 30GB heap therefore reserves up to 15GB of off-heap direct memory for network buffers and similar. - Metaspace and code cache, which grow with class loading and JIT output.
- Thread stacks, which scale with your thread pools and connection counts.
- GC internal structures, including G1’s remembered sets and card tables.
- Native processes on ML nodes, separate OS processes with their own resident memory entirely outside the JVM.
Add it up. A 64GB bare-metal box with a 30GB heap is comfortable: 30GB heap, up to 15GB direct, some tens of megabytes of JVM overhead, and roughly 18GB left for page cache. Tight, but workable.
Now try a 32GB container with a 16GB heap. Heap 16GB, direct memory defaults to 8GB, add metaspace and stacks and you’re at 25GB of process memory before the kernel caches a single segment file. Under a cgroup limit of 32GB, page cache pressure and the OOM killer are both in play now, and the OOM killer won’t leave you a heap dump to analyse — it watches RSS, not -Xmx, and RSS includes every off-heap consumer above. This is why the 50% rule matters in a container specifically: it’s protecting you from the OOM killer, not just from slow searches.
Elasticsearch JVM heap sizing by machine size
The procedure, in order:
- Determine node role. Dedicated masters and coordinating-only nodes need far less heap than hot data nodes. ML nodes need native memory left over.
- Take total RAM available to the process (the cgroup limit, if containerised, not the host’s RAM).
- Apply
min(50% of RAM, compressed-oops-safe value). - Subtract for known off-heap consumers if the box is doing anything else.
- Validate the result against your shard count (next section — the step people skip).
| Total RAM | Recommended heap | Notes |
|---|---|---|
| 8GB | 4GB | Fine for dev, small masters, coordinating nodes. Don’t put a hot tier here. |
| 16GB | 8GB | Workable data node for modest indices. Shard budget gets tight fast. |
| 32GB | 16GB | The sweet spot for a lot of mid-size clusters. Plenty of page cache. |
| 64GB | 26GB to 30GB | Verify compressed oops. Do not round up to 32GB. |
| 128GB | 2 nodes × 30GB | One 30GB node wastes RAM; two nodes use it. |
That last row is worth spelling out. Machines with substantially more than 64GB of RAM commonly run two Elasticsearch nodes per host rather than one oversized heap. Two JVMs at 30GB each gives you 60GB of heap and roughly 68GB left for page cache shared across both. Compare that to a single node capped at 30GB by the oops ceiling, leaving 98GB of page cache that one JVM’s thread pools can’t fully exploit anyway.
The catch: Elasticsearch, left alone, will happily place a primary and its replica on the two nodes sharing a chassis. Then one power supply fails and you’ve lost both copies, despite believing you had two. Tag the host and tell the allocator about it:
# elasticsearch.yml, on both nodes on the same physical box
node.attr.host_name: rack3-box7
cluster.routing.allocation.awareness.attributes: host_name
Set that before you add the second node, not after you’ve already been paged.
Setting Xms and Xmx correctly
jvm.options.d, not the shipped file
Don’t edit the shipped jvm.options file. It gets overwritten on upgrade, and you’ll lose your setting at the worst possible moment. Create your own file:
# /etc/elasticsearch/jvm.options.d/heap.options
-Xms30g
-Xmx30g
That’s the whole file.
Why Xms must equal Xmx
Xms and Xmx must match, for two reasons. Mechanically, a growing or shrinking heap forces stop-the-world resize work that shows up as unexplained pauses — you don’t want the JVM negotiating with itself the first time memory pressure spikes in production. And Elasticsearch’s production bootstrap checks fail startup outright if initial heap size doesn’t equal maximum heap size, so a mismatch on a node bound to a non-loopback address simply refuses to start.
If you set nothing at all, modern Elasticsearch (7.11 and later) auto-sizes the heap based on the node’s roles and total available memory. This works genuinely well for small and mid-size nodes, and I leave it alone on dev clusters. On production data nodes I set it explicitly — I want the number in version control where a human can see it during an incident, and auto-sizing trusts the memory Elasticsearch sees at startup, which cgroup quirks and multi-tenant hosts can make unreliable.
In containers, ES_JAVA_OPTS is the usual override path and it composes with jvm.options.d. Whichever you pick, pick one. I’ve debugged a cluster where the Helm chart set ES_JAVA_OPTS and a configmap mounted a jvm.options.d file, and the effective heap matched neither value anyone believed.
Supporting OS settings
Three supporting OS settings, all mandatory in my book:
bootstrap.memory_lock: truevm.max_map_count = 262144Disable swap entirely if you can. If you can’t, bootstrap.memory_lock: true locks the heap into RAM so the kernel can’t page it out — make sure the service’s LimitMEMLOCK allows it, or the node starts without the lock and only tells you in the logs. And vm.max_map_count needs to sit at 262144 minimum, because Lucene creates a very large number of memory-mapped areas; the default of 65530 on many distros gets you mmap failures that look like corruption.
Elasticsearch 8.x ships a bundled JDK and uses G1GC by default. 7.x on JDK 8 through 13 used CMS, with G1 selected on JDK 14 and later. Elasticsearch also enables -XX:+HeapDumpOnOutOfMemoryError out of the box, so an OOM leaves you a dump to analyse. Make sure the heap dump path has room for a file the size of your heap — a failed dump write on a 30GB heap node is a bad surprise.
Shards are the hidden heap consumer
Every shard on a node costs heap: segment metadata, per-field structures, the bookkeeping for the shard itself. Elastic’s guidance is to aim for fewer than 20 shards per GB of heap on each node, and to keep individual shards broadly in the 10GB to 50GB range.
Run the arithmetic, because it produces a hard number:
A 30GB heap × 20 shards/GB = 600 shards maximum on that node.
At a 30GB average shard size, 600 shards works out to roughly 18TB of data on that node. Most people hit the shard ceiling long before the storage ceiling, and they hit it because their index template says number_of_shards: 5 on a daily index that holds 4GB.
That template produces five shards of 800MB each, per day, per index pattern. Thirty index patterns and ninety days of retention is 13,500 shards for 108GB of data. Spread across six nodes with 30GB heaps, you have 2,250 shards per node against a budget of 600. The cluster will run. It will also spend its life in GC, and every heap graph you look at will insist you need more memory.
You don’t. You need one shard per daily index and a rollover policy targeting 30GB per shard, which turns 13,500 shards into a few hundred.
Reading heap pressure honestly: the post-GC live set
heap_used_percent is a sawtooth. It climbs to 75%, a collection runs, it drops to 30%, it climbs again. Alerting on the peak of a sawtooth generates noise and teaches your on-call to ignore heap alerts, which is worse than having no alert at all. I’ve had people escalate a 90% reading five minutes before a routine collection was about to bring it back down to 40%.
The number that matters is old-generation occupancy immediately after a full or mixed collection — the live set, the memory that couldn’t be reclaimed. If the live set after GC sits above roughly 75% of old gen, you’re out of headroom and the node is one expensive aggregation away from a breaker trip or a GC death spiral. Below about 50%, you have room regardless of what the peak looks like.
GET _nodes/stats/jvm?filter_path=nodes.*.name,nodes.*.jvm.mem.heap_used_percent,nodes.*.jvm.mem.pools.old,nodes.*.jvm.gc.collectorsThat gives you heap_used_in_bytes, per-pool old generation usage including peak_used_in_bytes, and GC collection counts and times per collector. Sample it twice a minute over a few hours and look at the floor of the old-gen curve, not the ceiling.
The other signal lives in the Elasticsearch log itself. The GC monitor emits warnings of the form [gc][young][...] overhead, spent [Ns] collecting in the last [Ms]. When the collecting time approaches the wall-clock window, the node is spending most of its life in GC and is effectively unavailable even though it hasn’t left the cluster yet. Grep for overhead, spent across your cluster logs before you tune anything. It’s the highest signal-to-noise line Elasticsearch produces.
Circuit breakers: the seatbelt, not the airbag
Since 7.0 the parent circuit breaker accounts for real JVM memory usage by default (indices.breaker.total.use_real_memory: true) with a limit of 95% of the heap. The fielddata breaker defaults to 40% of heap and the request breaker to 60%.
When a breaker trips, the client gets a 429 with a CircuitBreakingException naming the breaker and the byte amounts:
Data too large, data for [<http_request>] would be [31138512584/28.9gb],
which is larger than the limit of [30601641984/28.5gb]
That message is the system working correctly. A query got rejected so the node could survive. Someone will inevitably suggest raising the limit to make the errors stop, and I want to be blunt: raising the parent breaker limit is how you turn a failed query into a dead node. The breaker is the only thing standing between an unbounded aggregation and a heap dump. Move it to 98% and the same query now allocates past the point of recovery, the node OOMs or GC-thrashes itself out of the cluster, shards start relocating, and the relocation load pushes the next node over. I’ve seen that cascade take out four data nodes in about eleven minutes.
Treat every breaker trip as a bug report about the query or the mapping.
The five things that actually blow up your heap
Fielddata on analysed text fields. Someone sorts or aggregates on a text field. Elasticsearch has to build an in-memory inverted structure on the heap covering every term in that field across the shard. It’s disabled by default for exactly this reason. Symptom: fielddata breaker trips, and the fielddata section of _nodes/stats shows gigabytes on a field nobody meant to aggregate. Fix: use the keyword sub-field with doc values, which are read off-heap.
Unbounded terms aggregations. A terms agg with size: 100000 on a high-cardinality field, or a composite agg paginating over millions of buckets while the coordinating node holds the reduction. Symptom: request breaker trips on the coordinating node, not the data nodes. Fix: cap sizes, use composite aggs with proper pagination, or push the work to a transform.
Oversized bulk requests and abandoned scroll contexts. Bulk bodies are held in memory during parsing. Scroll contexts pin segments and their associated structures until they expire. Symptom: heap that climbs and never comes down, plus a growing open_contexts count. Fix: bulk bodies in the 5MB to 15MB range, search_after instead of scroll, short scroll TTLs.
Too many shards per node. Covered above. Symptom: high baseline heap with no query load at all.
Mapping explosion. Dynamic mapping on a document with unpredictable keys creates thousands of fields, and cluster state grows on every node, masters included. Symptom: slow cluster state updates and master instability alongside heap pressure. Fix: dynamic: strict or false on the offending object, or flattened field type.
The war story I keep telling: a logging cluster, six nodes, 64GB each, 30GB heaps, constant heap alerts, four rounds of “let’s add nodes.” I pulled _cat/shards and found 41,000 shards holding 2.1TB. Average shard size was 51MB. None of that cluster’s problem was heap. Rolling over at 40GB per shard and reindexing the historical daily indices into monthlies dropped it to about 900 shards. Post-GC old gen went from 84% to 22% and the alerts stopped. Same heap, same hardware.
A heap pressure troubleshooting checklist you can run against a live cluster
- Verify the heap.
GET _nodes/stats/jvmand confirmheap_max_in_bytesmatches what you think you configured. Check every node; drift is common. - Verify compressed oops. Run the JVM with
-Xlog:gc+heap+coops=info(JDK 9+) or-XX:+UnlockDiagnosticVMOptions -XX:+PrintCompressedOopsMode(JDK 8) at your configured heap size, on your actual hardware. Confirm compressed oops are on, ideally zero-based. - Verify Xms == Xmx and that the setting lives in
jvm.options.d/*.options, not in the shippedjvm.options. - Check post-GC old gen. Sample
nodes.*.jvm.mem.pools.oldand look at the floor, not the peak. Above 75% after collection means no headroom. - Grep for
overhead, spentin the last week of logs. - Check shards per GB of heap.
GET _cat/shardscount divided by node count divided by heap GB. If it exceeds 20, stop tuning heap and fix your shard strategy. - Check breaker trips.
GET _nodes/stats/breakerand look attrippedcounts per breaker. Non-zero on fielddata points at a mapping problem; non-zero on request points at a query problem. - Check swap and memory lock. Confirm
bootstrap.memory_lockis actually in effect (GET _nodes?filter_path=**.mlockall) and thatvm.max_map_countis at least 262144.
Sizing the heap is a fifteen-minute job. Take half of RAM, cap it below the compressed-oops threshold, verify it, set Xms equal to Xmx, lock it into RAM. Done — and it won’t need revisiting until you change hardware.
Everything after that is workload shaping, and that’s where the real work lives. A bigger heap almost never fixes heap pressure. Past the oops cliff it measurably makes things worse. The node is telling you it’s been asked to hold more than it can hold, and the honest response is to ask it to hold less. If you’d rather have someone else watch these numbers and catch the shard-count problem before it becomes a 3am page, that’s the kind of ongoing check a service like MyDBA runs for you.