Elasticsearch ILM Explained: Policies, Rollover, Retention
Elasticsearch Index Lifecycle Management for People Who Already Run Partitioned Tables
The 3,000-shard cluster nobody meant to build
The cluster came to me because search latency had gone bad and the master node kept dropping out. Three data nodes, 30 GB heap each, and about 400 GB of actual log data. That should be a boring cluster.
It had 3,240 shards.
The arithmetic was simple once someone drew it. Logstash was writing to three daily index patterns, the default template gave each index one primary and one replica, and retention was 18 months because nobody had ever said otherwise. 540 days × 3 patterns × 2 copies = 3,240 shards, averaging about 123 MB each. Elastic’s own sizing guidance puts shards in the tens of gigabytes, commonly cited as 10 to 50 GB, precisely because every shard costs fixed heap and file handles regardless of how little data it holds. The same 400 GB, packed at 50 GB per shard, needs 8 primaries. Sixteen shards with a replica. Not 3,240.
The heap pressure was not data volume. It was bookkeeping. Cluster state got large, master publication got slow, and the whole thing wobbled. That is the problem elasticsearch index lifecycle management was built for, and deletion is only the last of the four things it does.
The mental model: declarative partitioning, executed by the master
If you have built time-partitioned tables in Postgres, you already have the shape of this in your head.
Your daily or size-based indices are the child partitions. The write alias, or the data stream name, is the routing layer that makes writers care about one name instead of forty. The ILM policy is pg_partman plus a tiering policy plus a retention job, expressed as JSON and executed by a background process on the elected master. In Postgres you get retention by setting retention and retention_keep_table on a part_config row and letting the maintenance run detach or drop old children. In Elasticsearch you write one policy document, attach it to a template, and every index created from that template inherits the whole lifecycle.
Where the analogy breaks, and you should know this before you lean on it: Postgres prunes partitions against a declared partition key, at plan time and again at execution time, with the planner guaranteeing which children it can skip. Elasticsearch has no declared key. It skips work through index and data stream naming conventions plus a per-shard can_match pre-filter that consults min/max values for the range field. That is a heuristic operating on real data distribution, not a structural guarantee. A badly named or backfilled index can quietly defeat shard skipping in ways a mis-keyed Postgres partition simply can’t — the heuristic only works if your naming and ingestion timestamps stay honest. A query with no date filter fans out to every shard in the pattern. Partition pruning is a promise; shard skipping is an optimization that usually fires.
Directionally the same. Not the same.
The five phases and what each is actually for
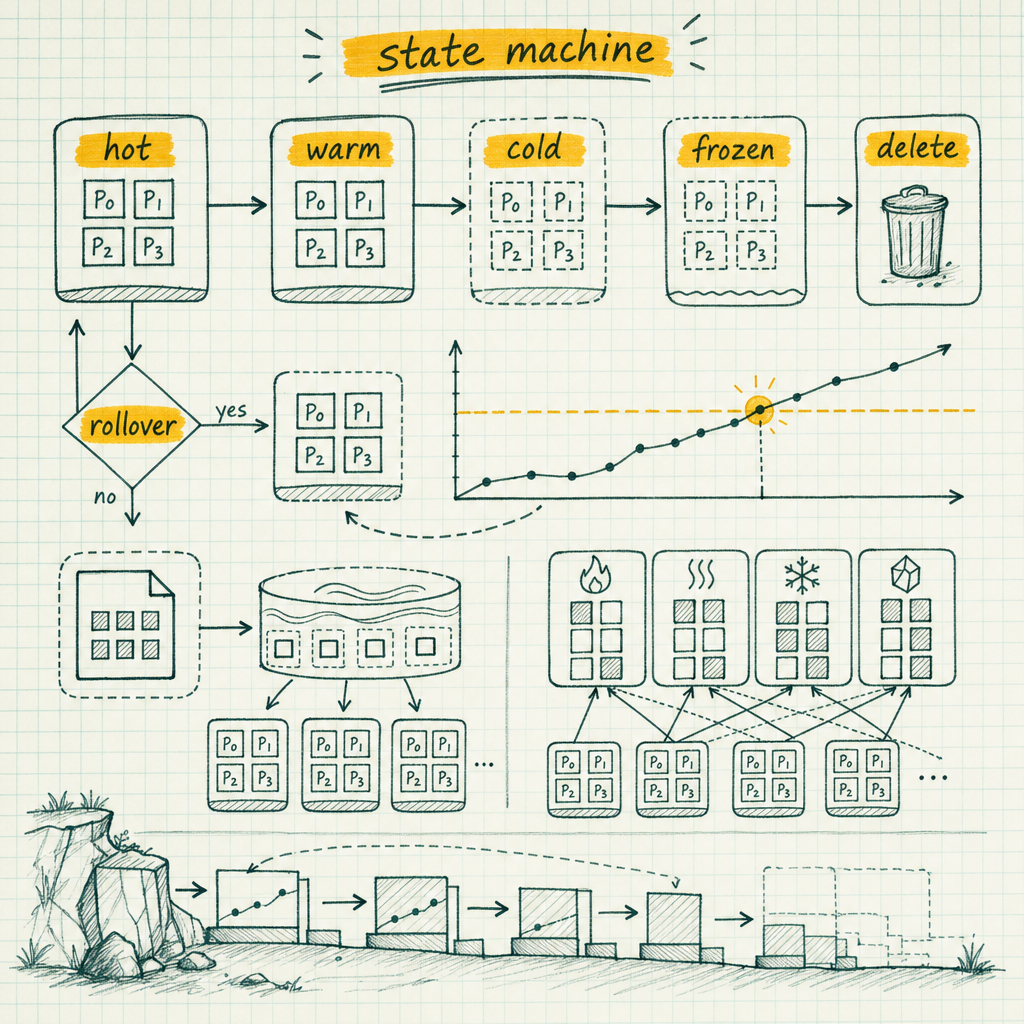
Phases execute in fixed order: hot, warm, cold, frozen, delete. An index never moves backwards. You can skip phases (most policies do), but you cannot un-shrink or un-freeze by editing the policy.
Each phase permits only a subset of actions. The table below reflects the 8.x actions reference; go check the actions page for the exact version you run, because the per-phase table has changed across major versions and you do not want to find out from a step_info.reason.
| Phase | Purpose | Typical hardware | Actions allowed |
|---|---|---|---|
| Hot | Active writes and the freshest queries | Fast NVMe, most CPU, data_hot |
rollover, set_priority, unfollow, forcemerge, shrink, readonly, searchable_snapshot, downsample |
| Warm | Read-only, still queried regularly | Cheaper disk, less CPU, data_warm |
set_priority, unfollow, readonly, allocate, migrate, shrink, forcemerge, downsample |
| Cold | Rarely queried, latency tolerated | Spinning disk or object storage via searchable snapshot, data_cold |
set_priority, unfollow, readonly, allocate, migrate, searchable_snapshot, downsample |
| Frozen | Compliance and “we might need it once” | data_frozen, snapshot mounted with partial cache |
unfollow, searchable_snapshot |
| Delete | Retention enforcement | None | wait_for_snapshot, delete |
This is the core of any ILM hot warm cold architecture, and three caveats are worth being honest about. Cold means one of two different things depending on your setup: either physically cheaper nodes reached through allocate/migrate, or a searchable snapshot mounted from object storage. The second needs a registered snapshot repository and a license tier that includes searchable snapshots. Frozen is the same story, except it does not keep a full local copy at all; it mounts the snapshot with a partial cache and pulls blocks on demand. That is why frozen storage costs almost nothing and frozen queries are slow enough that you should tell your users in advance. And a third, historical caveat: older policies sometimes still carry a freeze action, deprecated in favor of the frozen tier and searchable snapshots. If you inherit one, that’s a policy migration to schedule, not an emergency.
Rollover: the action everything else hangs off
Nothing in ILM works until rollover works, because every subsequent phase measures its clock from the moment rollover happened.
The rollover action takes max_primary_shard_size, max_age, max_docs, max_size, and matching min_* floor conditions. When you set several max conditions, they are OR’d. First one to trip wins.
Do not use max_size in a new policy. Elastic deprecated it in favour of max_primary_shard_size for a good reason: max_size measures the sum of all primaries, so the same threshold produces 25 GB shards on a 4-shard index and 12.5 GB shards on an 8-shard index. The number silently changes meaning when someone bumps number_of_shards in the template. max_primary_shard_size says what you actually mean, which is how big any single shard is allowed to get.
Here is the sizing arithmetic, worked with real numbers. Say you ingest 200 GB/day of primary (post-indexing, not raw JSON) log data and you want shards near the top of the recommended range, 50 GB.
- 200 GB/day ÷ 50 GB per shard = 4 primary shards’ worth of data per day.
- Set
index.number_of_shards: 4in the template andmax_primary_shard_size: 50gbin the rollover action. - The index rolls when any one primary hits 50 GB, so roughly every 24 hours, and you land on one index per day without ever writing a date pattern.
- Add
max_age: 7das a ceiling so a traffic collapse over a holiday week does not leave you with a stale open write index for a month.
At 90 days of retention that is 90 indices × 4 primaries = 360 primaries, plus replicas. Compare that to the 3,240 shards in the war story. Same data, an order of magnitude fewer objects in cluster state.
One thing that bites people: rollover is not instant. A master-node process polls managed indices on indices.lifecycle.poll_interval, which defaults to 10 minutes. Your index will sit at 53 GB for a bit. That is normal.
Wiring it up: data streams, or the legacy alias pattern
Modern: data stream
Attach the policy in the template block of a composable index template, not to the data stream object. This is the standard way to hook elasticsearch data streams ILM together.
PUT _index_template/logs-app
{
  "index_patterns": ["logs-app-*"],
  "data_stream": {},
  "priority": 500,
  "template": {
    "settings": {
      "index.lifecycle.name": "logs-90d",
      "index.number_of_shards": 4,
      "index.number_of_replicas": 1
    }
  }
}
Index into logs-app-prod and Elasticsearch creates the stream on first write. Backing indices are named .ds-logs-app-prod-2026.08.04-000001, and each rollover creates a new backing index and increments the generation counter.
Legacy: bootstrap index with a write alias
You still need this path when your documents are mutable. Data streams are append-only as far as the standard document APIs are concerned: no update or delete by ID through the normal endpoints. You can reach documents with update_by_query/delete_by_query or by addressing a backing index directly, and both of those are awkward as a routine write path. If your application does PUT /index/_doc/<id> on existing documents, use the elasticsearch rollover alias pattern instead.
PUT _index_template/events
{
  "index_patterns": ["events-*"],
  "template": {
    "settings": {
      "index.lifecycle.name": "logs-90d",
      "index.lifecycle.rollover_alias": "events",
      "index.number_of_shards": 4
    }
  }
}

PUT %3Cevents-{now/d}-000001%3E
{
  "aliases": {
    "events": { "is_write_index": true }
  }
}
The URL-encoded angle brackets are Elasticsearch’s date-math index naming syntax — it resolves to something like events-2026.08.04-000001 at creation time, which keeps your bootstrap index name consistent with what rollover will generate afterward.
Both halves are mandatory. is_write_index: true tells Elasticsearch where writes go; index.lifecycle.rollover_alias tells ILM which alias to swing. Miss either and the rollover step fails with a message you will read at 3 a.m.
A production policy, annotated
This elasticsearch ILM policy example matches the log-ingest scenario above:
PUT _ilm/policy/logs-90d
{
  "policy": {
    "phases": {
      "hot": {
        "min_age": "0ms",
        "actions": {
          "rollover": {
            "max_primary_shard_size": "50gb",
            "max_age": "7d"
          },
          "set_priority": { "priority": 100 }
        }
      },
      "warm": {
        "min_age": "3d",
        "actions": {
          "set_priority": { "priority": 50 },
          "readonly": {},
          "shrink": { "number_of_shards": 1 },
          "forcemerge": { "max_num_segments": 1 }
        }
      },
      "cold": {
        "min_age": "30d",
        "actions": {
          "set_priority": { "priority": 0 },
          "searchable_snapshot": { "snapshot_repository": "s3-logs" }
        }
      },
      "delete": {
        "min_age": "90d",
        "actions": {
          "wait_for_snapshot": { "policy": "nightly-slm" },
          "delete": {}
        }
      }
    }
  }
}
Knob by knob. set_priority controls recovery order after a full cluster restart; hot indices come back first, cold last, and on a 90-index cluster that difference is felt. readonly before shrink is deliberate, since shrink needs a quiet index anyway. shrink from 4 to 1 works because 1 is a factor of 4. forcemerge to a single segment buys real query speed and disk savings on an index that will never take another write.
If you’re not on the built-in data-tier node roles and still manage warm/cold hardware through custom node attributes, add an explicit allocate action instead of relying on implicit tier migration. allocate accepts both a require/include block for node attributes and a number_of_replicas field, so you can drop replica count as data cools in the same action that moves it.
Do not put forcemerge in the hot phase. I have watched someone do it to “keep things tidy”. Force merge is a heavy, single-threaded-per-shard I/O grind that competes directly with indexing on the same disk, and merging an index that is still receiving writes just produces new segments to merge again. Ingest latency went from 40 ms to over two seconds on the p99. Merge when writes have stopped.
For a metrics workload, drop shrink and add downsample in warm; a 10-second interval rolled to 5 minutes at 7 days cuts document count by 30× and metrics dashboards rarely care. For an audit log with a compliance floor, remove searchable_snapshot if your query SLA cannot absorb object-storage latency, and read the next section carefully before you promise anyone an exact retention number.
The timing rule that surprises everyone
min_age is measured from the moment the index rolled over, or from index creation for an index that never rolls, not from the timestamps of the documents inside it. This is the single most misunderstood part of any elasticsearch index retention policy.
Work the policy above with a 7-day hot window. An index opens, collects documents for up to 7 days, then rolls. From that rollover instant the clock starts: warm at +3d, cold at +30d, delete at +90d.
So the newest document in that index is deleted 90 days after it was written. The oldest document in the same index was written up to 7 days before rollover and is deleted 97 days after it was written. Your actual retention is a 90-to-97 day band, not a line.
If your requirement is “retain at least 90 days”, you are fine. If it is “delete no later than 90 days”, you are out of compliance by up to a week, and the fix is to shorten the hot window so the spread narrows. A 1-day max_age gives you 90 to 91.
Verify it with the explain lifecycle API rather than reasoning about it — especially before you sign off on a retention policy that someone else will cite in an audit. age is time since the lifecycle date; lifecycle_date_millis is the rollover timestamp when there was one; phase_time_millis tells you when the current phase began.
The four commands you will actually run
GET .ds-logs-app-prod-*/_ilm/explain?only_errors=true
GET _ilm/status
POST .ds-logs-app-prod-2026.07.22-000042/_ilm/retry
POST .ds-logs-app-prod-2026.07.22-000042/_ilm/move/step
only_errors=true is the one you want on a cluster with hundreds of indices; there is also only_managed if you are auditing coverage. A failing index looks like this:
{
  "indices": {
    ".ds-logs-app-prod-2026.07.22-000042": {
      "index": ".ds-logs-app-prod-2026.07.22-000042",
      "managed": true,
      "policy": "logs-90d",
      "index_creation_date_millis": 1753142400000,
      "lifecycle_date_millis": 1753747200000,
      "age": "9.31d",
      "phase": "warm",
      "phase_time_millis": 1754006400000,
      "action": "shrink",
      "step": "ERROR",
      "failed_step": "check-shrink-allocation",
      "failed_step_retry_count": 41,
      "step_info": {
        "type": "illegal_state_exception",
        "reason": "lifecycle action [shrink] waiting for [4] shards to be allocated to nodes matching the given filters"
      }
    }
  }
}
step: "ERROR" plus failed_step plus step_info.reason is the whole diagnosis. Fix the cause, then POST _ilm/retry to re-run the failed step. _ilm/move/step is the escape hatch when an index is wedged somewhere it can never succeed; you hand it the current step and the next step and ILM jumps. Use it sparingly and know that you are skipping work, not doing it.
Six failure modes, ranked by how often I have seen them
Rollover alias misconfigured. index.lifecycle.rollover_alias missing, or pointing at an alias where no index has is_write_index: true. Presents as an index sitting in hot forever with a check-rollover-ready error — the classic ILM stuck check-rollover-ready symptom, and it’s almost always the culprit after a manual index restore.
ILM globally stopped. Someone ran POST _ilm/stop before a rolling upgrade and never ran _ilm/start. Every index freezes at whatever step it was on. GET _ilm/status returns STOPPED or STOPPING and takes two seconds to check. Put it in your post-maintenance checklist.
Shrink blocked. Shrink needs a copy of every shard on one node, and the target count must be a factor of the source count. Nine shards to two will never succeed. Neither will four shards on a cluster where no single node has room for all four. Both leave the index parked in the shrink step, retrying.
Force merge on a hot index. Covered above. Do not.
Allocate pointing at node attributes that do not exist. You wrote "require": {"data": "warm"} and nobody ever set node.attr.data on the warm nodes. The index sits in ALLOCATION_COMPLETE waiting for a filter that can never be satisfied, and you won’t see an obvious error — just an index parked on hot-tier hardware indefinitely. If you are on modern data tiers, use migrate and let tier preference handle it.
Edited policy, unchanged behaviour. An index mid-phase keeps executing the cached definition of that phase and only picks up your edit when it enters the next phase. So you halved the hot rollover threshold, watched nothing happen, and assumed the edit failed. It did not. The index is still running the version it started with.
ILM or data stream lifecycle?
Newer Elasticsearch also ships a simpler data stream lifecycle that handles retention and downsampling without any tiering concept. Fewer knobs, less to get wrong. Where both a DLM and an ILM policy apply to the same data stream, ILM wins unless you flip prefer_ilm.
Decision rule: if you move data between hardware tiers or take searchable snapshots, use ILM; if all you want is “keep 30 days, downsample after 7”, use DLM and skip the state machine entirely.
Testing a policy without waiting 90 days
On a throwaway cluster, set indices.lifecycle.poll_interval to 10s, write a copy of your policy with max_docs: 1 and min_age values in seconds, index three documents, and watch the whole lifecycle execute in under two minutes. Check _ilm/explain after each transition so you see the actual step names, not the ones you assumed. Then substitute the real numbers.
Never leave a short poll interval on production. It is master-node work on every managed index on every tick, and on a large cluster that is a real, self-inflicted load.
What to steal for your Postgres clusters
Three things ILM does that hand-rolled partition maintenance usually does not.
Retention is declarative and lives with the schema, so a new table inherits the policy instead of needing a new cron entry. There is an age dimension separate from the data’s own timestamps, which is worth understanding even if you decide you dislike it. And there is a machine-readable endpoint that tells you exactly why a thing is stuck, with a step name and a reason string.
pg_partman gives you the first. The third is the gap. If your partition maintenance fails at 2 a.m., you are reading logs, not querying a status view that says failed_step: "detach-partition". Build that view yourself, or lean on a tool like MyDBA that surfaces these failures automatically — a table recording last-run, next-run and last-error per partitioned parent takes an afternoon and pays for itself the first time someone else is on call.