Elasticsearch Monitoring: Metrics That Predict Outages
Elasticsearch Monitoring: The Signals That Actually Predict Outages
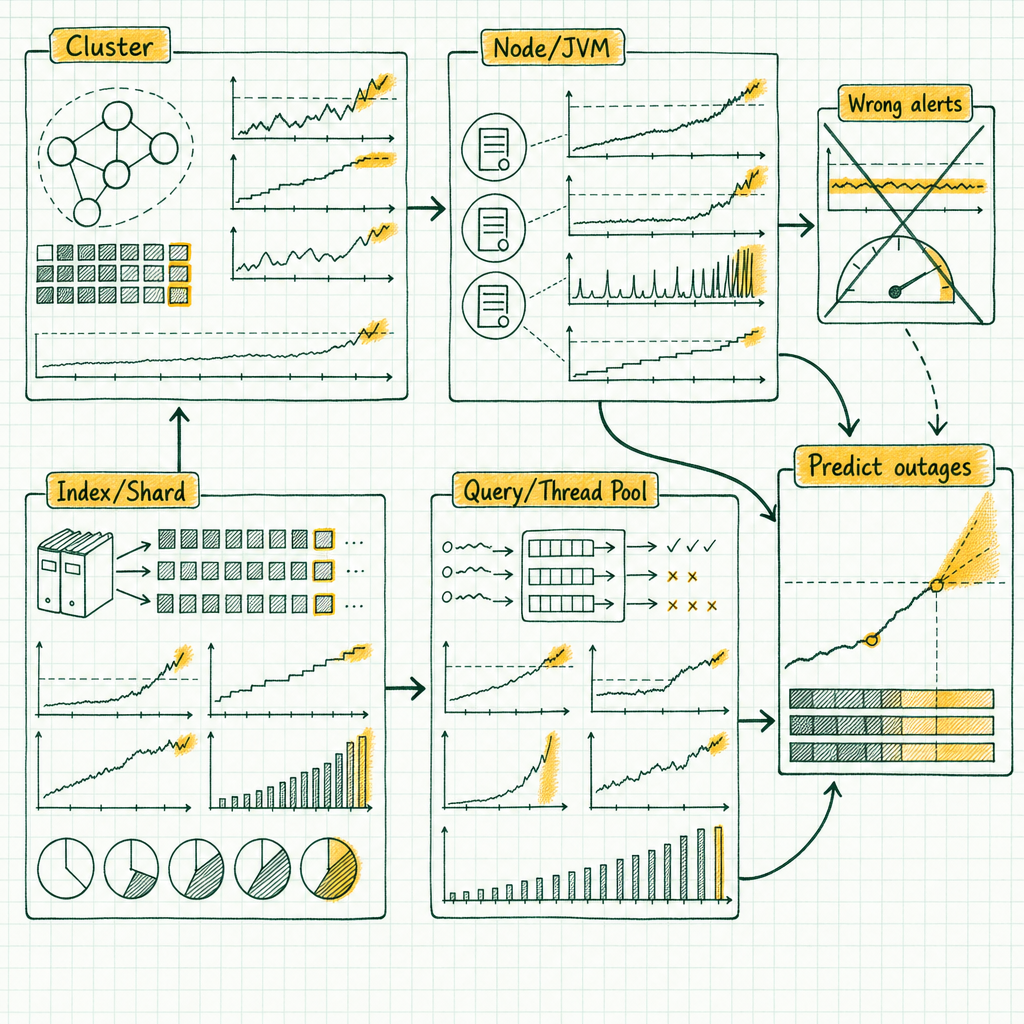
Effective Elasticsearch monitoring means watching four layers — cluster state, node/JVM heap, index and shard sizing, and the query/write path — because cluster health colour alone tells you almost nothing about whether the cluster can actually serve requests. Here’s what to pull from each layer, what thresholds are defensible, and what deserves to wake a human.
Why green isn’t healthy (and yellow isn’t an incident)
Cluster health colour describes shard allocation. That’s it. Green means every primary and every replica is allocated. Yellow means every primary is allocated but at least one replica isn’t. Red means at least one primary shard is unallocated. The colour says nothing directly about query latency, indexing throughput, heap pressure, or whether the cluster is answering anything correctly.
I have watched a perfectly green cluster time out every search request for eleven minutes because two data nodes were in back-to-back full GC pauses. Health stayed green the whole time, because shards were allocated. They were allocated to nodes that could not respond.
I have also been paged at 2am for a yellow cluster that was in exactly the state it should have been: a node had been restarted as part of a planned rolling upgrade, delayed allocation was holding replicas in place rather than triggering a cluster-wide rebuild, and the whole thing resolved itself once the node rejoined. That page cost an hour of sleep and produced nothing.
Both of those are monitoring failures, not Elasticsearch failures. The fix is to stop treating cluster colour as the primary signal and instead watch four layers, each of which fails in its own way:
- Cluster state — allocation, master responsiveness, pending tasks.
- Node and JVM — heap, garbage collection, circuit breakers.
- Index and shard — shard count and size drift, merges, translog, mapping growth.
- Query and write path — thread pools, rejections, slow queries.
The rest of this is what to pull from each layer, what thresholds are defensible, and what should be allowed to wake a human.
One caveat before anything else, and it matters: metric names, default settings, and API response shapes have shifted across 6.x, 7.x, 8.x and 9.x. Everything below is written against the current documented behaviour, but verify against the version you actually run before you turn any of it into an alert rule. Defaults in particular have a habit of moving.
Layer 1: Elasticsearch cluster health, and what _cluster/health actually tells you
GET _cluster/healthThe response carries more signal than the colour field most people extract from it:
{
  "cluster_name": "prod-search",
  "status": "yellow",
  "number_of_nodes": 11,
  "number_of_data_nodes": 8,
  "active_primary_shards": 842,
  "active_shards": 1655,
  "relocating_shards": 4,
  "initializing_shards": 2,
  "unassigned_shards": 29,
  "delayed_unassigned_shards": 29,
  "number_of_pending_tasks": 0,
  "task_max_waiting_in_queue_millis": 0,
  "active_shards_percent_as_number": 98.1
}
Read that top to bottom and you can classify the situation without touching another API. delayed_unassigned_shards equal to unassigned_shards with zero pending tasks means a node left recently and delayed allocation is doing its job. Nothing is broken. index.unassigned.node_left.delayed_timeout defaults to one minute, and its entire purpose is to avoid a stampede of replica rebuilds when a node bounces for thirty seconds.
number_of_nodes versus your expected node count is a better availability signal than colour, and it’s trivially alertable because you know how many nodes you provisioned.
The field almost nobody graphs is task_max_waiting_in_queue_millis. That is how long the oldest pending cluster-state task has been sitting in the master’s queue. A master that is healthy processes these in milliseconds. A master that is drowning (too many indices, too many shards, mapping updates arriving constantly from dynamic mapping, or a master node undersized on heap) shows a queue that grows and a max-wait that climbs into seconds and then tens of seconds. Every index creation, mapping update and allocation decision goes through that queue. When it backs up, index creation starts hanging and nothing in your latency dashboards explains why.
Follow-ups, in order:
GET _cluster/health?level=indices
GET _cluster/health?level=shards
GET _cluster/pending_tasks
GET _cluster/allocation/explain
level=indices is how you find which single index is holding the cluster red. On a cluster with 400 indices, that saves you scrolling _cat/shards output. Call _cluster/allocation/explain with an empty body and it will pick an arbitrary currently-unassigned shard and tell you exactly which allocation decider said no and why. That output is verbose and worth reading in full. The common answers are disk watermarks, awareness/allocation filtering rules someone set and forgot, and “no valid shard copy” after a data loss event, which is a very different conversation. If _cluster/pending_tasks is long and not draining, you have a master bottleneck, and the fix is almost never “add more nodes” — it’s usually reducing the rate of cluster-state-changing operations hitting the master.
Layer 2: Elasticsearch JVM heap monitoring, where clusters actually die
If you only get to instrument one thing, instrument heap.
Elasticsearch heap is not a cache dial you turn up for more speed. It holds cluster state, segment metadata, in-flight query data structures, aggregation buckets, indexing buffers, and field data. The filesystem cache, which is what actually makes searches fast, lives outside the heap in the OS. Which is why the sizing guidance is to give the JVM no more than 50% of available memory and leave the rest to the OS page cache, and to stay under the compressed ordinary object pointers threshold, roughly 26–30GB depending on the JVM. Cross that line and you can end up with less usable memory than you had before, because pointers get wider.
GET _nodes/stats/jvm,breaker,thread_poolFrom the jvm section, the metrics worth keeping:
mem.heap_used_percentper node.gc.collectors.old.collection_countandcollection_time_in_millis, as deltas.gc.collectors.young.*, same treatment, mostly for context.
The shape matters more than any single reading. Healthy heap sawtooths: it climbs, a collection runs, it drops back to something like 30–50%. The dangerous pattern is a sawtooth whose floor is rising. When the post-collection low sits above about 75% and keeps climbing, the JVM is spending increasing effort to reclaim decreasing amounts of memory, and old-gen GC time per minute starts rising with it. That is the point of no return, and it typically shows up hours to days before the node actually falls over.
Alert on the floor, not the peak. A node touching 90% heap momentarily during a big aggregation is normal. A node that never drops below 78% for twenty minutes is a scheduled outage.
Circuit breakers are the other half of this. Elasticsearch runs a parent breaker plus child breakers for field data, request-level structures, and in-flight requests, all designed to reject work before the JVM hits OutOfMemoryError. In modern versions, the parent breaker is backed by the real-memory circuit breaker, which checks actual JVM memory usage rather than just estimated request sizes — that’s why it catches allocation spikes that the older, purely accounting-based breakers used to miss. It’s still a backstop, not a fix. The breaker section of nodes stats gives you limit_size_in_bytes, estimated_size_in_bytes and tripped per breaker.
tripped is a counter, and I’ll come back to counters shortly, because this is where most monitoring goes wrong.
Operationally, a tripped parent breaker means requests are being refused to save the node. Users see 429s or errors. The node stays up. That is the breaker working. A tripped fielddata breaker usually means someone ran an aggregation or a sort on an analyzed text field, and the correct response is to fix the query or the mapping rather than raise the limit. Raising breaker limits to make errors go away is how you convert a rejected query into a dead node.
Layer 3: Elasticsearch shard sizing, the slow leak nobody alerts on
Nothing in this layer will page you. All of it will eventually cause something else to page you.
Shard size and count drift. Elastic’s sizing guidance puts shards in a broad band, commonly cited as 10–50GB, with under 200 million documents per shard as a secondary rule of thumb, and fewer than roughly 20 shards per GB of heap on each node. Those are guidance ranges, not physics. But drift outside them predicts trouble reliably.
GET _cat/shards?v&s=store:desc
GET _cat/indices?v&s=store.size:desc
GET _cluster/stats
Sort shards by store descending and look at the top twenty. If you find a 240GB shard, someone’s daily index rollover stopped working weeks ago and nobody noticed, and recovery of that shard after a node failure will take a very long time. Sort ascending instead and count how many shards are under 1GB. A cluster with 4,000 tiny shards is spending heap on segment metadata and master time on cluster state for no benefit.
Then check the total against the ceiling. cluster.max_shards_per_node defaults to 1000 open shards per non-frozen data node, and it is enforced: exceed it and shard creation fails with a validation error, usually at midnight UTC when the daily indices roll over. That is a genuinely common outage, and it is fully predictable from a graph of total shards versus node count times 1000. Alert at 80% of the ceiling and you will never see it in production.
Mapping growth. The default limit is 1000 fields per index, via index.mapping.total_fields.limit. Dynamic mapping applied to semi-structured documents drives straight at that number. Every new field is a cluster state update, and cluster state gets replicated to every node.
Merge and refresh backlog. From _nodes/stats/indices, watch merges.current, merges.total_time_in_millis, refresh.total_time_in_millis, flush.total_time_in_millis and translog size. Rising merge time with rising segment counts means the merge threads are losing to the ingest rate. Refresh defaults to every second for indices that have received a search in the last 30 seconds, and raising index.refresh_interval on heavy-ingest indices is the standard lever. On a log ingest pipeline where nobody searches data less than a minute old, a 30 second refresh interval is free throughput.
This layer is worth a standing monthly audit, not just a look when something breaks:
GET _cat/indices?v&h=index,docs.count,store.size,pri,rep&s=store.size:desc
GET _cat/shards?v&h=index,shard,prirep,state,docs,store&s=store:desc
GET _cluster/stats?filter_path=indices.shards.total,indices.mapping.total_field_count
Run that once a month against last month’s numbers and shard drift, orphaned indices, and creeping field counts show up as a diff instead of an incident.
Layer 4: Thread pool rejections and slow logs
This is the single most useful command during an incident:
GET _cat/thread_pool?v&h=node_name,name,active,queue,rejectednode_name name active queue rejected
es-data-01 search 13 0 412
es-data-01 write 4 0 0
es-data-02 search 13 118 9021
es-data-02 write 8 47 1544
es-data-03 search 2 0 0You can read the failure straight off that: es-data-02 is saturated on both search and write while its peers are idle, which points at a hot shard on that node rather than a cluster-wide load problem.
Now the most common monitoring bug in Elasticsearch, stated plainly: rejected is a cumulative counter since node start. It never resets except on restart. If you alert on rejected > 0, you have built an alert that fires forever after the first rejection the node ever experienced, and stops firing entirely after a restart clears the counter. I have seen this exact rule in three different companies’ alerting repos. Alert on the rate of change: rejections per minute above some small number, sustained. In Prometheus terms, rate() or increase(), never the raw gauge.
Elasticsearch keeps separate thread pools per operation type, each with its own size and queue capacity, and rejects when the queue fills. Search rejections and write rejections mean different things. Search rejections mean queries are arriving faster than shards can serve them, or one query type is monopolising threads. Write rejections mean ingest is outrunning the indexing path, and the upstream producer is about to start retrying, which makes it worse.
Here’s the first place the usual advice is wrong. The standard answer to rejections is to raise queue_size. That doesn’t add capacity. It adds waiting. A bigger queue converts a fast, visible rejection that your client can retry with backoff into a slow request that occupies memory, holds a connection, and times out somewhere less convenient — right back onto the heap you were trying to protect in Layer 2. queue_size is a knob for hiding problems. Occasionally you want it, for genuinely bursty bulk ingest where the burst is short and the average is fine. Most of the time, a rejection is telling you the truth and you should listen.
For finding which query, configure Elasticsearch slow logs per index rather than globally:
PUT /orders-2026.08/_settings
{
  "index.search.slowlog.threshold.query.warn": "5s",
  "index.search.slowlog.threshold.query.info": "2s",
  "index.search.slowlog.threshold.fetch.warn": "1s",
  "index.indexing.slowlog.threshold.index.warn": "2s",
  "index.indexing.slowlog.threshold.index.info": "1s"
}
Slow logs are index-level settings with separate thresholds per level, separate query and fetch phases for search, and they’re dynamically updatable. Per-index matters because a 2 second threshold that is reasonable for a 400GB analytics index will flood your logs on a 2GB reference index where everything should return in 20ms.
Remember that search fans out from a coordinating node to shard copies in a query phase then a fetch phase, and the response is gated by the slowest shard. One oversized or badly-placed shard sets your p99 for the whole index. That’s why per-node thread pool output beats an aggregate latency graph for diagnosis.
To find what’s running right now:
GET _tasks?actions=*search&detailed
POST _tasks/<task_id>/_cancel
GET _nodes/hot_threads
hot_threads samples stack traces of the busiest threads per node and tells you whether you’re burning CPU in merges, in GC, in a regex-heavy script, or in a wildcard query nobody should have written.
A worked incident
Four days of buildup, twenty minutes of outage.
Monday: heap floor on the six data nodes sat around 58%, normal for that cluster. Old-gen collections were running about twice an hour with a combined 400ms per minute of GC time.
Wednesday: heap floor at 71%. Old-gen GC time at 1.4s per minute. Nothing paged, because the only heap alert was at 90% instantaneous, which never triggered.
Thursday morning: first write rejections appeared, single digits per minute, on two nodes. Nobody noticed, because the alert was rejected > 100 against the cumulative counter and had been in a permanent firing-and-silenced state since a load test in March.
Thursday 14:20: task_max_waiting_in_queue_millis went from 0 to 4,100. Index creation for the next hourly index hung. Search p99 went from 180ms to 9s.
Root cause: a new service had started shipping HTTP request logs with the query string parsed into individual fields. Every unique query parameter became a new mapping field. One index had gone from 60 fields to 940 in four days, chasing the 1000-field default. Each new field was a mapping update, each mapping update was a cluster state change replicated to every node, and cluster state lives in heap. Heap pressure caused longer GC pauses, longer pauses slowed the write pool, the write pool queued and then rejected, and the master queue backed up behind mapping updates.
The fix was a mapping correction — an explicit mapping for the query-string field with dynamic mapping disabled on that path — plus a reindex of the affected index. Heap floor dropped back to baseline within one GC cycle of the reindex completing. Every one of the signals above was visible days ahead. None of them were alerted on, because the alerting was built around cluster colour and CPU, and the cluster was green with CPU at 40% for the entire buildup.
The alert set you can actually live with
| Signal | Classification | Reasoning |
|---|---|---|
status: red |
Page | A primary is unallocated. Writes to that index fail and data may be unreachable. |
| Unassigned primaries > 0 for more than 5 minutes | Page | Same as above, expressed in a way that survives brief allocation churn. |
| No master elected / master unreachable | Page | Nothing can be created, allocated, or rebalanced. |
| Node count below expected for more than 5 minutes | Page | More reliable availability signal than colour. |
| Heap floor above 78% sustained 15 minutes | Page | The pre-failure state described above. Tune the number to your cluster’s normal floor. |
| Thread pool rejection rate above zero, sustained 5 minutes | Page | Rate, not counter. Users are being refused. |
| Any node above flood-stage disk watermark | Page | Indices are about to go read-only. |
status: yellow past the delayed allocation window plus recovery time |
Ticket | Expected during restarts; a problem if it persists. |
Total shards above 80% of max_shards_per_node × data nodes |
Ticket | Predicts a hard failure at next index creation. |
Mapping field count above 80% of total_fields.limit |
Ticket | The timebomb from the incident above. |
| Old-gen GC time per minute trending up week over week | Ticket | Leading indicator, never an emergency in itself. |
| Any shard above 60GB or index with shards under 1GB | Ticket | Sizing drift, fix during business hours. |
| Doc counts, indexing rate, search rate, segment counts | Dashboard | Context for diagnosis, useless as alerts. |
| CPU utilisation | Dashboard | High CPU during merges is the system working. |
Treat every number there as a starting point to be calibrated against two weeks of your own baseline. A threshold you copied from a blog post and never tuned will either page you constantly or never at all.
Disk watermarks, or why your cluster went read-only
Three watermarks, defaults 85%, 90% and 95%.
At low (85%), Elasticsearch stops allocating new shards to that node. Existing shards stay. Your cluster may go yellow when a new index is created and its replicas have nowhere to go.
At high (90%), Elasticsearch starts relocating shards away from the node. This is when you see mysterious relocation traffic and I/O load with no deployment to blame.
At flood stage (95%), Elasticsearch applies a read-only-allow-delete index block to every index with a shard on that node. Writes fail. Deletes are permitted, which is the point: the block exists so you can delete data and recover.
Since 7.4, that block is released automatically once disk drops below the high watermark. In earlier versions it was not, and you had to clear it by hand. This is why so many runbooks still carry a manual unblock step, and why people on 8.x run that step out of habit against a cluster that already cleared it. Know which version you’re on.
The second place the usual advice is wrong: the common recommendation is to raise the watermarks when you hit them. Raising flood stage to 97% buys you two percent of disk and removes the safety margin that lets you actually delete data. The right response is to find the node first — GET _cat/allocation?v shows disk percent used per node in one call — and figure out whether it’s genuine growth or a stuck index that should have rolled over weeks ago. Then delete indices, add nodes, or move to larger disks. The watermark is not the problem.
How to monitor Elasticsearch in production
Three viable paths.
Elastic Stack monitoring / Metricbeat’s elasticsearch module. Best coverage of Elasticsearch-specific internals, integrates with Kibana’s monitoring UI, and Elastic maintains it against version changes. Cost is another agent and a Beats config to manage.
Prometheus with prometheus-community/elasticsearch_exporter. Widely deployed community exporter, scrapes the same APIs and exposes cluster, node, index and thread pool metrics in Prometheus format. If your alerting already lives in Prometheus and Alertmanager, this is the path of least friction, and rate() makes the counter problem hard to get wrong.
Direct API polling into whatever you already run. Perfectly legitimate. A cron job hitting _cluster/health, _nodes/stats and _cat/thread_pool every 30 seconds and writing to your existing metrics store gives you exactly the fields you care about with no dependency drift. This is what I’d do for a small cluster.
The rule that outranks the choice: never store monitoring data in the cluster you’re monitoring. Elastic recommends a dedicated monitoring cluster for a reason. When your production cluster goes red at 3am, its monitoring indices are on the same broken shards, its Kibana is querying the thing that’s down, and your entire evidence trail vanishes at the exact moment you need it. A two-node monitoring cluster on small instances is cheap insurance. I have twice been in incidents where the honest answer to “what did heap look like before it fell over?” was that we had no idea.
The 30-minute triage runbook
Ordered, with what each step rules in or out.
1. GET _cluster/health
   Colour, node count, unassigned, task_max_waiting_in_queue_millis.
   Rules in/out: allocation problem vs master overload vs neither.

2. GET _cluster/health?level=indices
   Only if not green. Identifies the specific index.

3. GET _cat/thread_pool?v&h=node_name,name,active,queue,rejected
   Rules in/out: saturation, and whether it is one node or all of them.
   Compare rejected against your last known value, not against zero.

4. GET _nodes/stats/jvm,breaker
   Heap per node, breaker tripped counts.
   Rules in/out: GC pause storm as the underlying cause.

5. GET _cat/shards?v&s=store:desc
   Oversized shards, and which node holds the hot one.
   Also check for UNASSIGNED state here: distinguishes real data
   unavailability from a pure performance problem with everything
   allocated.

6. GET _cluster/allocation/explain
   Only if unassigned shards are stuck. Gives the decider's actual reason.

7. GET _nodes/hot_threads
   For any node that is CPU-saturated but not GC-bound.
   Rules in/out: merges vs scripts vs expensive queries.

8. GET _tasks?actions=*search&detailed
   Find the long-running search. Cancel it if it is the cause:
   POST _tasks/<task_id>/_cancel
Steps 1 through 4 take under two minutes and correctly classify the large majority of incidents. The discipline is running them in order rather than jumping to hot_threads because it feels productive.
What transfers from Postgres, and what doesn’t
If you came to Elasticsearch from Postgres, some instincts port cleanly.
Cumulative counters and delta-based alerting transfer directly. Everything you learned about pg_stat_database and pg_stat_bgwriter (reset semantics, rate over value, the uselessness of an absolute count since server start) applies verbatim to rejected, tripped, and the GC counters. The people who get Elasticsearch monitoring wrong are usually the ones who never had to internalise that lesson elsewhere.
The “autovacuum is falling behind” instinct maps well to merge and refresh backlog. Both are background maintenance competing with foreground work, both degrade slowly, both produce a characteristic pattern where nothing looks broken until it very much is. If you already graph vacuum lag, you’ll graph merge backlog correctly on the first try.
Bloat monitoring maps loosely to segment counts and deleted-document ratios, though the mechanics differ enough that I’d hold the analogy lightly.
Where it breaks down: there is no MVCC, no single writer, and no transaction to be long-running. The closest structural equivalent to a long-running transaction blocking DDL is a stuck cluster-state task on the master, which is why task_max_waiting_in_queue_millis deserves the attention I gave it. Cluster state is a distributed consensus object replicated to every node, so a mapping change has a cost profile with no Postgres counterpart. There’s no single coordinator holding all the locks the way pg_stat_activity implies, either — a coordinating node handles a given request, a master node governs cluster state, and those are different failure domains entirely. And there is no query planner to reason about in the way you’d read an EXPLAIN ANALYZE; the search profile API tells you where time went, but the dominant factor is usually shard placement and count rather than anything resembling plan choice.
Don’t force the analogy further than that. The useful transfer is the operational temperament: distrust absolute counters, alert on the leading indicator rather than the symptom, and keep your evidence somewhere the failure can’t reach. If you’re managing both engines and want a second set of eyes on the Postgres half, MyDBA is one option, but the discipline above is the part that matters and it’s yours to build either way.