Elasticsearch Shards: Sizing, Limits & Allocation
Elasticsearch Shards: The Sizing Decision That Pages You Six Months Later
Most Elasticsearch incidents I have been called into were not caused by the thing that broke. They were caused by an index.number_of_shards value typed into a template a long time ago by someone who has since changed jobs.
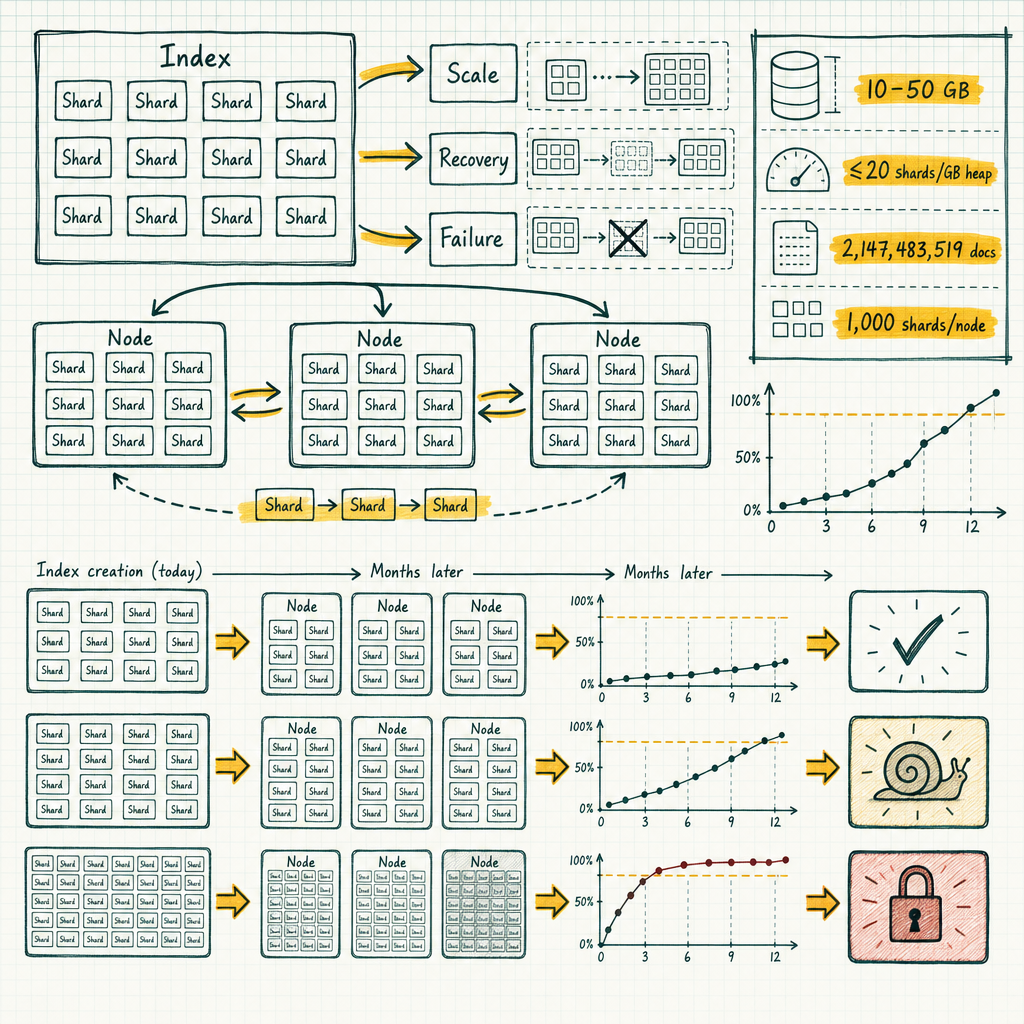
The cluster goes red at midnight UTC. Or search p99 triples on a Tuesday with no traffic change. Or an index quietly flips read-only and your ingest pipeline starts logging 403s. Underneath all three is the same root: shard count and shard size were chosen before anyone knew what the data would look like, and Elasticsearch has no equivalent of ALTER TABLE to fix it in place.
This is written for people who already understand relational internals. I will lean on Postgres analogies where they hold and tell you plainly where they fall apart, because the places they fall apart are exactly where people get burned.
What a shard actually is
A primary shard is a complete, self-contained Lucene index. Not a slice of one. Not a pointer into one. Its own segments, its own inverted index structures, its own merge policy, its own translog.
When you search an index with 12 primaries, Elasticsearch does not run one query. It runs 12 queries, one per shard, then a coordinating node merges the results and computes the final ranking. Every shard adds fan-out to every search that touches the index.
The closest Postgres analogy is a hash-partitioned table. Documents are distributed by a hash of a routing key, the same way rows land in p0 through p7 under PARTITION BY HASH. The routing formula is:
shard_num = hash(_routing) % num_primary_shards_routing defaults to the document _id. Because _id is high-cardinality and effectively random for auto-generated IDs, distribution across shards is close to uniform. If you set a custom routing value (tenant ID, customer ID) you get something like partition pruning: a search with the same routing value hits one shard instead of all of them. That is a genuine win for multi-tenant search, and a genuine risk if one tenant is 40% of your corpus.
Here is where the analogy breaks. In Postgres you can ATTACH and DETACH partitions, and with some pain you can restructure a partitioned table. In Elasticsearch, number_of_shards is a static setting. It is fixed at index creation and the modulo in that routing formula is the reason: change the divisor and every document’s shard assignment changes. There is no in-place path. Your options are reindex, split, or shrink, all of which rewrite data.
The other broken analogy: a Postgres partition is cheap. An empty partition costs you a relfilenode and a catalog row. An empty Elasticsearch shard costs heap, file handles, and a line in the cluster state that the elected master publishes to every node in the cluster. Shards are not free at rest.
Primaries versus replicas
These solve different problems and people conflate them constantly.
Primaries determine write parallelism and are static. Indexing throughput scales with primary count up to the point where you run out of CPU or disk. You choose this number once.
Replicas determine read capacity and redundancy, and are dynamic. index.number_of_replicas can be changed on a live index with a single PUT, and Elasticsearch will start copying data immediately.
Adding replicas never speeds up indexing. It slows it down. Every document written to a primary is forwarded to each replica and indexed there too, so going from one replica to two adds roughly 50% more indexing work across the cluster. Replicas buy you query throughput and survivability, and you pay in write cost, disk, and heap.
A replica is a full independent copy. One replica doubles your storage bill and doubles your shard count. That matters enormously once you start counting against the per-node shard limits below.
One rule that catches people: Elasticsearch will never put a primary and its own replica on the same node. So an index with number_of_replicas: 2 on a two-node cluster can never be fully allocated. The surplus replica sits UNASSIGNED and cluster health stays yellow forever. With N nodes you can support at most N-1 replicas.
Sizing math
The published guidance from Elastic is 10 GB to 50 GB per shard for most search and time-series workloads. That range is not arbitrary.
The lower bound exists because per-shard overhead is real. Each shard carries heap for its segment metadata, terms dictionaries, and field data structures. A hundred 500 MB shards cost dramatically more heap than five 10 GB shards holding the same documents.
The upper bound exists because of recovery and rebalance time. A shard is the unit of movement. When a node dies, the cluster copies whole shards to restore redundancy. Recovery is throttled by default: cluster.routing.allocation.node_concurrent_recoveries is 2 per node, and indices.recovery.max_bytes_per_sec is 40 MB/s for general-purpose data nodes. Do the arithmetic on a 400 GB shard at 40 MB/s and you get about two and a half hours for a single copy, assuming nothing else competes.
The second budget is heap-based. Aim for 20 shards or fewer per GB of heap on each node.
Worked example. Six data nodes, each with 64 GB RAM. Elastic recommends heap at no more than 50% of RAM and below the compressed-oops threshold (roughly 26 to 30 GB depending on JVM), so you set 30 GB heap and leave the other 34 GB to the filesystem cache that Lucene actually reads through.
6 nodes × 30 GB heap × 20 shards/GB = 3,600 shards total budgetCross-check against the hard cap: cluster.max_shards_per_node defaults to 1000, so 6 × 1000 = 6,000. The heap budget binds first, which is normal. Your real ceiling is 3,600 shards.
Now invert it. At 40 GB per shard, 3,600 shards holds roughly 144 TB of primary-and-replica data, or about 72 TB of unique data at one replica. If your actual footprint is 20 TB, you need about 500 primaries plus 500 replicas, not 3,600 shards. Size to the data, then check you are under budget, not the other way around.
The numbers, in one place
| Limit | Value | Type |
|---|---|---|
| Target shard size | 10–50 GB | Guidance |
| Shards per GB of heap | ≤ 20 | Guidance |
cluster.max_shards_per_node |
1000 open shards per non-frozen data node | Default, configurable |
| Docs per shard | 2,147,483,519 (Integer.MAX_VALUE - 128) |
Hard Lucene limit |
| Shards per index at creation | 1024 | Default, JVM property es.index.max_number_of_shards |
| Disk watermarks | 85% low / 90% high / 95% flood stage | Defaults, configurable |
| Watermark max_headroom | 200 GB low / 150 GB high / 100 GB flood | Defaults |
| Default primaries, 7.0+ | 1 (was 5 in 6.x) | Default |
That doc ceiling is worth internalising. 2,147,483,519 documents per shard is a Lucene structural limit, not a tuning knob. High-cardinality metrics workloads hit it. When you do, indexing fails and no setting will save you.
And on defaults: five primaries per index was never a sensible default. It was a hedge that guessed wrong for the majority of indices, and it stopped being the default in 7.0 for good reason. If you still have 6.x-era templates in your repo, that number is probably still in them.
The oversharding tax
Oversharding rarely announces itself with an error. It shows up as latency and master instability, which is why teams chase the wrong thing for weeks.
The costs, concretely:
Heap and file handles. Every open shard holds structures in heap regardless of query traffic. Thousands of small shards can consume a double-digit percentage of your heap doing nothing.
Cluster state. Every index, every shard, and every mapped field is recorded in the cluster state. The elected master publishes that state to all nodes on every change. Large shard and field counts make publication slow, and a master spending its time serialising and shipping a giant cluster state is a master that is not doing its actual job. This is how “we have too many shards” becomes “our master keeps stepping down.”
Search thread pool saturation. Each shard in a search request consumes one search thread. The search pool is bounded, by default int((allocated_processors * 3) / 2) + 1. On a 16-core node that is 25 threads. A query fanning out to 300 shards on that node does not get 300-way parallelism, it gets 25-way parallelism and a queue.
max_concurrent_shard_requests. This defaults to 5 per node per request. Past that, shard work on a node serialises. Shard count beyond your parallelism ceiling adds coordination overhead and gives you nothing.
Postgres people will recognise the shape of this. It is the same reason a table with 4,000 partitions plans slowly even when the query touches one of them. Planning and coordination cost scales with the object count, not the data volume.
Undersharding and the shard you can’t split
The opposite failure is quieter until it is catastrophic. One 400 GB primary.
It cannot be searched in parallel beyond its own segment concurrency. It takes hours to recover. It blocks rebalancing because the allocator has nothing granular to move, so your disk usage stays lopsided and you cannot fix it without moving a huge chunk of data.
The APIs that promise to help have conditions:
Shrink requires that every shard of the source index has a copy on one single node, that the index is blocked for writes, and that the target shard count is a factor of the source count. 10 to 5, yes. 10 to 3, no.
Split requires the source index to be read-only, and can only multiply the shard count by a factor consistent with index.number_of_routing_shards, which is fixed at index creation. If nobody thought about routing shards when the index was made, split may not be available at the factor you want.
Which is why the honest answer, most of the time, is reindex behind an alias. Create the correctly sized index, reindex into it, atomically flip the alias, drop the old one. Your application never sees the swap. It costs you I/O and a maintenance window’s worth of patience, but it is the operation that always works, and I would rather plan a reindex than discover mid-incident that split refuses my factor.
Do not go looking for a setting that fixes a badly sized index. There isn’t one.
Allocation: how Elasticsearch decides where a shard lives
The allocator runs a chain of deciders. Any one of them can veto.
Same-shard decider. A primary and its replica never share a node. Non-negotiable.
Disk threshold decider. Watermarks, covered below.
Awareness. cluster.routing.allocation.awareness.attributes spreads primaries and replicas across node attributes such as availability zone. Forced awareness goes further and prevents the cluster from cramming replicas into surviving zones when a zone drops. Without forced awareness, losing a zone can trigger a rebalance that fills the remaining nodes and pushes you into a disk incident on top of the zone incident.
Filtering. index.routing.allocation.include/exclude/require by node attribute is how hot/warm/cold tiers are implemented. New indices land on fast NVMe nodes, aged indices get filtered onto dense spinning-disk nodes.
index.routing.allocation.total_shards_per_node. Caps how many shards of one index may live on a single node. This is the correct tool for stopping one hot index from concentrating on three nodes out of twelve. Set it too aggressively and you will manufacture unassigned shards, so leave headroom for node failures.
The limits that cause outages
cluster.max_shards_per_node
Default 1000 open shards per non-frozen data node. Exceed it and index creation fails with a validation error naming the current and maximum counts, something in this shape:
{"error":{"root_cause":[{"type":"validation_exception",
"reason":"Validation Failed: 1: this action would add [2] shards, but this
cluster currently has [12000]/[12000] maximum normal shards open;"}],
"type":"validation_exception",
"reason":"Validation Failed: 1: this action would add [2] shards, but this
cluster currently has [12000]/[12000] maximum normal shards open;"},"status":400}
If you are reading this because you searched that string: you do not have a bug. You have a capacity policy doing its job. Raising the limit buys you time and makes the eventual failure worse.
The watermarks
- 85% low. No new shards allocated to that node.
- 90% high. Elasticsearch actively tries to relocate shards off it.
- 95% flood stage. An
index.blocks.read_only_allow_deleteblock is applied to every index with a shard on that node.
Recent versions cap the percentages with max_headroom settings, defaulting to 200 GB free for low, 150 GB for high, and 100 GB for flood stage, so a 20 TB disk triggers on absolute free space rather than waiting until 95%.
Since 7.4, the flood-stage block releases automatically once usage drops back below the high watermark. On older versions you cleared it by hand, usually at 3am, usually after twenty minutes of confusion about why writes were failing but the cluster was green.
This is the same design philosophy as Postgres transaction ID wraparound protection. The system refuses writes to save itself from an unrecoverable state. Nobody enjoys it, everybody should be glad it exists.
Recovery throttles
node_concurrent_recoveries at 2 and indices.recovery.max_bytes_per_sec at 40 MB/s are why a rebalance after adding nodes can take a full day. They exist so recovery does not starve live traffic. Raise them deliberately, during a known window, and put them back.
A logging cluster that overshared itself into red
Real shape of a real incident, numbers rounded.
Twelve data nodes, 30 GB heap each. About 40 application log indices created daily, each with 5 primaries and 1 replica because the template was copied from a 6.x cluster in 2018. Retention 30 days.
40 indices × 5 primaries × 2 (with replica) = 400 shards/day
400 × 30 days = 12,000 shards
12 nodes × 1000 max_shards_per_node = 12,000 cap
Ingest was around 600 GB/day, so 200 primaries a day averaged 3 GB per shard. Every one of them below the recommended floor, and the heap budget said 12 × 30 × 20 = 7,200 shards. They were running at 167% of the heap-based guidance before anything went wrong.
At 00:00 UTC on day 31, index creation hit the cap. Ingest backed up, the master started struggling with cluster state publication, and health went yellow then red as shards failed to allocate.
Diagnosis, in order:
GET _cat/shards?v&s=store:desc
GET _cat/allocation?v
GET _cluster/allocation/explain
_cat/shards sorted by store showed the p99 shard at 4 GB and thousands of shards under 1 GB. _cat/allocation showed shard counts near 1000 per node with disk at 70%, so this was a shard-count wall, not a disk wall. _cluster/allocation/explain returned the decider verdict for a specific unassigned shard and named the limit directly, which ended the argument about whether it was a disk problem.
The fix, in two phases:
Immediate. Delete the oldest two days to get under the cap, restore index creation, stop the bleeding. Not elegant. Correct.
Structural. Replace daily indices with a data stream using ILM rollover on max_primary_shard_size: 50gb, primaries dropped from 5 to 1 per backing index. Warm phase at 2 days: shrink to 1 primary where applicable, force merge to 1 segment, move to warm nodes.
New steady state: 600 GB/day at 50 GB shards is roughly 12 primaries plus 12 replicas per day. About 720 shards across 30 days instead of 12,000. Search p99 dropped because queries stopped fanning out to hundreds of tiny shards.
Rollover and ILM: size by outcome, not by guess
The reason people overshard is that they are guessing at future volume at index-creation time, and guessing high feels safe.
max_primary_shard_size on the rollover action, available since 7.13, removes the guess. You declare the outcome you want (50 GB shards), and the index rolls over when its largest primary reaches it. Traffic doubles, you roll twice as often. Traffic collapses, you roll less. No template edits.
{
  "policy": {
    "phases": {
      "hot": {
        "actions": {
          "rollover": { "max_primary_shard_size": "50gb", "max_age": "7d" }
        }
      },
      "warm": {
        "min_age": "2d",
        "actions": {
          "shrink": { "number_of_shards": 1 },
          "forcemerge": { "max_num_segments": 1 }
        }
      },
      "cold": {
        "min_age": "30d",
        "actions": {
          "searchable_snapshot": { "snapshot_repository": "cold-repo" }
        }
      }
    }
  }
}
Force merge is the closest thing here to VACUUM FULL or CLUSTER: it rewrites segments down to a small number, reduces heap, and speeds queries. Same caveat as its Postgres cousins. Run it only on indices that are no longer being written to. On an active index it fights the merge policy and wastes I/O. Segment merging in general is a decent mental match for compaction, with the important difference that Lucene segments are immutable and deletes are tombstones reclaimed at merge time.
For append-only data, rollover on max_primary_shard_size should be your default, not a tuning trick you reach for after an incident. A cold phase that moves aged, no-longer-written indices to searchable snapshots takes the same logic one step further: you stop paying for redundant replica storage on data you are only occasionally querying, while the shard is still fully searchable.
A shard health checklist you can run today
Run these on a cluster you own before someone else runs them for you.
1. Shards per node against your heap budget.
GET _cat/allocation?vCompare the shards column to nodes × heap_GB × 20. If a node is above 1000 shards you are one index creation away from a rejection. Above 20 per GB of heap and you are already paying the tax.
2. Shard size distribution.
GET _cat/shards?v&s=store:descLook at the top and the bottom. Anything above 100 GB is a recovery liability. A long tail under 1 GB means you are burning heap on nothing. You want the bulk of the distribution sitting between 10 and 50 GB.
3. Shard count per index against actual data volume.
GET _cat/indices?v&s=store.size:desc&h=index,pri,rep,docs.count,store.sizeDivide store.size by pri. If a 6 GB index has 5 primaries, that template needs fixing, and fixing means reindex behind an alias, not a settings PUT.
4. Explain every unassigned shard.
GET _cluster/allocation/explainDo not guess. It names the decider that vetoed and why. Disk watermark, same-shard, awareness, total_shards_per_node, or the max-shards limit. Five seconds of reading beats an hour of theorising.
5. Watermark headroom.
GET _cat/allocation?v&h=node,disk.percent,disk.availAny node above 80% is on the clock. Remember the max_headroom caps: on large disks you can trip protection well below 85%. Confirm your monitoring alerts on absolute free space too, not only percentage.
6. Replica count against node count.
If number_of_replicas exceeds N-1 nodes, those replicas will never allocate and your cluster will be permanently yellow. People have run for months in that state, assuming yellow was normal.
None of this is exotic. It is capacity planning with different vocabulary, and the same discipline you would apply to partition counts, autovacuum thresholds, and free space monitoring on a relational estate carries over almost intact. The difference is that Elasticsearch makes the most consequential decision irreversible at creation time, and then waits, patiently, until 00:00 UTC on the wrong Tuesday.