Elasticsearch Unassigned Shards: Diagnose and Fix Fast
Elasticsearch Unassigned Shards: Diagnose and Fix Fast
Elasticsearch always knows why a shard won’t allocate — it keeps a per-node, per-rule record of the decision. Most people never ask for it, so they guess, restart nodes, and eventually run a reroute command from a forum that quietly throws away a week of data.
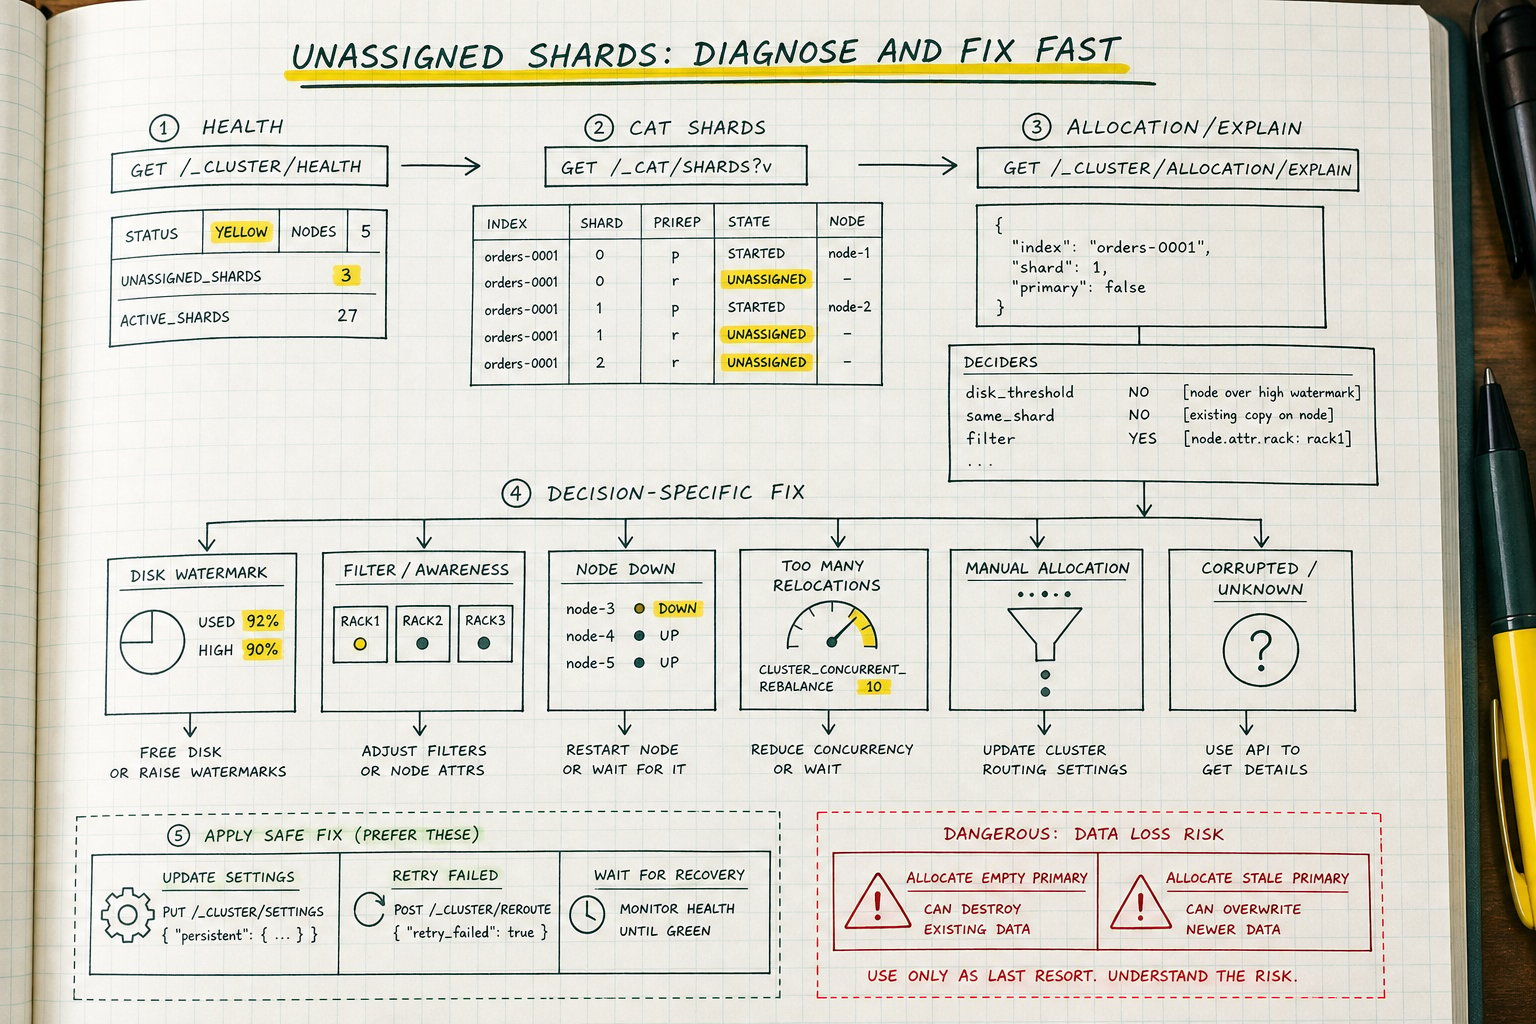
Here’s the flow that actually works: check health, list the shards, run allocation explain, then apply a fix based on which decider said no. Ten minutes, most of the time.
Yellow vs. red: know which one you have
A shard is a self-contained Lucene index holding a slice of an Elasticsearch index’s data. A primary shard accepts writes. A replica shard is a copy of a primary that also serves reads. Every index is split into some number of primaries, each with zero or more replicas.
The status colours, stated once:
- Yellow: every primary shard is assigned to a node. At least one replica shard is not. Search and indexing work fine. Your redundancy is gone or reduced, so the next node failure is the real incident.
- Red: at least one primary shard is unassigned. That slice of data cannot be searched or written. Queries touching it return partial results or fail.
Red is triage now. Yellow is triage today, before something else breaks. Yellow clusters can sit unassigned for months because nobody wants to own the ticket — then a second node failure turns it into an outage that a healthy cluster would have shrugged off.
GET _cluster/health{
"cluster_name": "logs-prod",
"status": "yellow",
"number_of_nodes": 6,
"number_of_data_nodes": 6,
"active_primary_shards": 1842,
"active_shards": 3610,
"relocating_shards": 0,
"initializing_shards": 4,
"unassigned_shards": 74,
"active_shards_percent_as_number": 97.9
}Read unassigned_shards and active_shards_percent_as_number together. Seventy-four unassigned out of ~3,700 with status yellow is a replica problem on a handful of indices. If status were red, skip the percentage and go straight to finding which primaries are missing.
initializing_shards: 4 is not a fault — the shard is copying segments or replaying operations and will go active on its own. Same for relocating_shards. Before touching anything, confirm whether the cluster is already fixing itself:
GET _cat/recovery?active_only=true&vIf rows show bytes_percent climbing, wait five minutes. Recovery concurrency is throttled by default — node_concurrent_recoveries defaults to 2 per node, indices.recovery.max_bytes_per_sec defaults to 40mb — so a terabyte of replica data legitimately takes a while and can look stalled when it’s only slow.
What this looks like to a Postgres DBA
An Elasticsearch replica behaves more like a per-shard streaming standby than a Postgres read replica of a whole database. Each shard has its own primary, its own translog, its own recovery. A six-node cluster with 3,600 shards runs thousands of tiny replication relationships simultaneously.
There’s no single WAL you can inspect and no pg_stat_replication view that tells the whole story. Allocation state lives in the cluster state, a document maintained by the elected master node and gossiped to everyone else. When you ask why a shard is unassigned, you’re asking the master to re-run its placement logic and narrate the result.
Step 1: which shards, and what happened?
GET _cat/shards?v&h=index,shard,prirep,state,unassigned.reason,unassigned.at,node&s=stateindex shard prirep state unassigned.reason unassigned.at node
logs-app-2026.07.28 0 r UNASSIGNED NODE_LEFT 2026-08-04T01:12:44.101Z
logs-app-2026.07.28 1 r UNASSIGNED NODE_LEFT 2026-08-04T01:12:44.101Z
metrics-host-000214 3 p UNASSIGNED ALLOCATION_FAILED 2026-08-03T22:07:19.554Z
orders-v3 0 r UNASSIGNED INDEX_CREATED 2026-08-04T02:31:02.900Zprirep tells you p (primary) or r (replica). One primary in that list means the cluster is red.
The unassigned.reason column is a category of event, not a diagnosis. Its values include INDEX_CREATED, CLUSTER_RECOVERED, INDEX_REOPENED, NEW_INDEX_RESTORED, EXISTING_INDEX_RESTORED, REPLICA_ADDED, ALLOCATION_FAILED, NODE_LEFT, REROUTE_CANCELLED, REINITIALIZED, REALLOCATED_REPLICA, PRIMARY_FAILED, FORCED_EMPTY_PRIMARY and MANUAL_ALLOCATION.
Each one describes what put the shard into the unassigned pool — none explains why it’s still sitting there. NODE_LEFT tells you a node dropped out at some point; it doesn’t tell you whether the shard is stuck because the node hasn’t returned, disk is full, a stale exclude filter is blocking it, or something else entirely. That answer comes from a separate API.
Step 2: make the cluster explain itself
This is the whole game, and it’s the single API most people troubleshooting Elasticsearch never learn exists.
GET _cluster/allocation/explainWith an empty body, Elasticsearch picks an arbitrary unassigned shard and explains it — often enough when everything is unassigned for the same reason. To target one:
GET _cluster/allocation/explain
{
  "index": "logs-app-2026.07.28",
  "shard": 0,
  "primary": false
}
A trimmed real response:
{
  "index": "logs-app-2026.07.28",
  "shard": 0,
  "primary": false,
  "current_state": "unassigned",
  "unassigned_info": {
    "reason": "NODE_LEFT",
    "at": "2026-08-04T01:12:44.101Z",
    "details": "node_left [Xk9dQ2vLSU2n3wV0mVjZ1g]",
    "last_allocation_status": "no_attempt"
  },
  "can_allocate": "no",
  "allocate_explanation": "Elasticsearch isn't allowed to allocate this shard to any of the nodes in the cluster. Choose a node to which you expect this shard to be allocated, find this node in the node-by-node explanation, and address the reasons which prevent Elasticsearch from allocating this shard there.",
  "node_allocation_decisions": [
    {
      "node_id": "T4pLm0aHQ7uQeS9Yy1x2Zw",
      "node_name": "es-data-03",
      "node_decision": "no",
      "deciders": [
        {
          "decider": "disk_threshold",
          "decision": "NO",
          "explanation": "the node is above the high watermark cluster setting [cluster.routing.allocation.disk.watermark.high=90%], having less than the minimum required [0b] free space, actual free: [7.4%]"
        }
      ]
    },
    {
      "node_id": "Rb2cX8fNTGqzMh4kJ0pQrA",
      "node_name": "es-data-01",
      "node_decision": "no",
      "deciders": [
        {
          "decider": "same_shard",
          "decision": "NO",
          "explanation": "a copy of this shard is already allocated to this node"
        }
      ]
    }
  ]
}
Where the answer lives:
can_allocategives the verdict.nomeans no node will take it.throttledmeans the cluster wants to but is rate-limiting, which resolves itself.allocate_explanationis generic prose. Skim it, don’t stop there.node_allocation_decisions[].deciders[].decideris the root cause. That string is the name of the rule that vetoed the placement.- The
explanationinside the decider names the specific parameter and value — above, the exact setting and the actual free space.
A decider returns YES, NO, or THROTTLE. A single NO on a node disqualifies that node. When every node returns NO, the shard stays put.
The rest of this guide is organised by decider name, because that’s how you should be thinking about it.
The decider map
| Decider | What it means | Where to look | Typical fix |
|---|---|---|---|
disk_threshold |
Node is over a disk watermark | GET _cat/allocation?v |
Free space, expand disk, temporary watermark bump |
same_shard |
A copy of this shard already lives there | Node count vs number_of_replicas |
Add a node, or reduce replicas on non-prod |
filter |
Include/exclude/require allocation rules | GET _cluster/settings?flat_settings=true and index settings |
Remove stale exclusions or fix attribute values |
awareness |
Forced zone awareness holding a replica back | Awareness settings, missing zone | Restore the zone |
data_tier |
Index wants a tier no node provides | _tier_preference on the index |
Add tier nodes or override preference |
max_retry |
Allocation failed 5 times, retries exhausted | unassigned_info.details |
Fix underlying error, then retry_failed |
node_version |
Target node runs an older ES version than the copy’s last host | Node versions | Finish or roll forward the upgrade |
shards_limit |
total_shards_per_node cap reached |
Index settings | Raise or remove the cap |
Cause 1: nowhere legal to put the replica
Elasticsearch never puts a primary and its replica on the same node — that’s the same_shard rule, and you cannot turn it off. There’s also cluster.routing.allocation.same_shard.host (default false), which, when enabled, extends the same protection across multiple node instances sharing a physical host — common in some Kubernetes deployments — so a hardware failure doesn’t take out primary and replica together.
The consequence that trips up everyone new to ES: a single-node cluster with the default one replica per index is permanently yellow. There’s no configuration of a one-node cluster where that resolves itself.
On a laptop or CI cluster, set number_of_replicas: 0 deliberately and move on. In production, dropping replicas to 0 to clear yellow deletes your only spare copy of the data in exchange for a green dashboard — the next disk failure takes the index with it.
Cause 2: disk watermarks
This is the one that eats logging clusters.
Defaults: cluster.routing.allocation.disk.watermark.low = 85%, high = 90%, flood_stage = 95%. At the low watermark Elasticsearch stops allocating new shards to that node. At high it actively tries to relocate shards away. At flood stage it applies an index.blocks.read_only_allow_delete block to every index with a shard on that node — whether or not that index is the one filling the disk — which is what turns “the cluster is a bit full” into “ingestion has stopped.”
On very large disks, 8.x adds max_headroom caps alongside the percentage watermarks, so on multi-terabyte volumes you’re not left waiting for the last 15% to fill before anything happens.
GET _cat/allocation?vshards disk.indices disk.used disk.avail disk.total disk.percent node
612 1.7tb 1.8tb 201gb 2tb 90 es-data-03
598 1.5tb 1.6tb 412gb 2tb 79 es-data-01Fixes, in order of preference: delete or force-merge old indices, roll the ILM policy forward, expand the volume. Adjusting the watermarks upward is a bridge to buy an hour, not a fix — write the revert into the incident ticket before you run it.
One reflex to unlearn: since 7.4, the flood-stage read-only block releases automatically once usage drops below the high watermark. Manually clearing the block while the disk is still at 96% gets you a few minutes of writes and then the same block again.
War story. Five data nodes, 2 TB each, an ILM policy that deleted indices at 30 days when retention had quietly been changed to 45 in a config repo nobody re-applied. Disk crept from 78% to 91% over eleven days. The first symptom was 38 unassigned replicas on the newest logs-app-* indices, not a disk alert, because the disk alert threshold was 92%. The explain output showed disk_threshold on every node. Deleting 14 old indices took four minutes and the cluster went green nine minutes later, most of that being replica recovery.
Cause 3: allocation disabled or filtered, usually by you, last Tuesday
The classic rolling-restart footgun. cluster.routing.allocation.enable accepts all, primaries, new_primaries and none. You set it to primaries before the restart so replicas wouldn’t rebuild, the restart went fine, and nobody set it back. Primaries assign, replicas never do, cluster sits yellow indefinitely.
First command on any cluster you didn’t configure yourself:
GET _cluster/settings?include_defaults=false&flat_settings=trueRead every transient and persistent setting before you touch anything else. Make this the first thing you run on any inherited cluster — it takes thirty seconds and saves you from chasing a disk problem that’s actually a forgotten exclude filter.
What to look for:
cluster.routing.allocation.enableset to anything butallcluster.routing.allocation.exclude._nameor._ipleft over from a decommission that finished in March- Index-level
index.routing.allocation.require/include/excludepointing at node attributes that no longer exist
Index-level filters need checking per index:
GET logs-app-2026.07.28/_settings?flat_settings=trueThe decider name for all of these is filter, and the explanation string names the exact setting and value — for example, node does not match index setting [index.routing.allocation.require] filters [box_type:"hot"]. If no node carries box_type: hot any more, there’s your answer.
Cause 4: data tiers and aspirational ILM
A tier is a role a node advertises (data_hot, data_warm, data_cold, data_frozen) describing what class of storage it provides. Index placement follows index.routing.allocation.include._tier_preference.
Someone writes an ambitious ILM policy — hot, warm, cold, frozen — that moves indices to warm at 7 days and cold at 30. The policy is correct. The cluster has six nodes, all data_hot. At day 7 the index gets a tier preference of data_warm, the data_tier decider returns NO on every node, and shards go unassigned, waiting for infrastructure that was never provisioned.
Fix properly by adding nodes with the warm role. Fix immediately by overriding the preference on the affected indices:
PUT logs-app-2026.07.20/_settings
{
  "index.routing.allocation.include._tier_preference": "data_hot"
}
Then fix the ILM policy so it stops doing this every night at midnight.
Cause 5: awareness and shards-per-node limits
cluster.routing.allocation.awareness.force.<attribute>.values tells Elasticsearch to withhold replica allocation until a node with the missing attribute value joins. If you have forced zone awareness across zone-a, zone-b, zone-c and zone-c is down, the replicas that belong in zone-c stay unassigned on purpose. The cluster is refusing to cram three copies into two zones and violate your own placement policy.
That’s the feature working. Restore the zone. Disabling awareness at 3am to turn a dashboard green removes the guarantee you paid for and produces a shard layout you’ll have to unwind later.
The other tight-fit case is index.routing.allocation.total_shards_per_node, often set during a capacity squeeze and forgotten. The decider name is shards_limit.
Adjacent and worth knowing: cluster.max_shards_per_node defaults to 1000 open shards per non-frozen data node. Exceeding it doesn’t unassign existing shards, but it blocks new index creation with a validation_exception. On log clusters this shows up in the same incident, because whatever caused your unassigned shards also stopped the nightly rollover.
Cause 6: ALLOCATION_FAILED and max_retry
index.allocation.max_retries defaults to 5. After five failed attempts, Elasticsearch stops trying and the max_retry decider returns NO. The shard stays unassigned even after you’ve fixed the actual problem, because nothing is retrying.
POST _cluster/reroute?retry_failed=trueBefore running that, read unassigned_info.details in the explain output. It carries the real exception: a CorruptIndexException, an IO error on a specific segment file, a mapping incompatibility. Running retry_failed against an unfixed cause burns another five attempts and puts you back where you started, five minutes older.
War story. Three-node cluster, metrics-host-000214 shard 3, primary, ALLOCATION_FAILED. The details field named a FileSystemException: Too many open files. The node’s nofile limit had been reset to 4096 by a systemd unit change in a base image rollout. Raising the limit and restarting the node took twelve minutes. The shard didn’t come back on its own, because retries were exhausted. One retry_failed and it recovered in 40 seconds.
Cause 7: NODE_LEFT and delayed allocation (do nothing, deliberately)
index.unassigned.node_left.delayed_timeout defaults to 1m. When a node leaves, Elasticsearch waits before rebuilding its replicas elsewhere, on the theory that a node restarting will be back shortly and its shard copies are still on disk and reusable — rebuilding a full replica from scratch would be wasted work.
The explain output states plainly when a shard is in this window, with allocation_delayed and the remaining time. Do nothing. It resolves itself.
For a planned rolling restart, raise the timeout first:
PUT _all/_settings
{
  "index.unassigned.node_left.delayed_timeout": "10m"
}
On a cluster holding terabytes per node, that’s the difference between the node coming back in 90 seconds and Elasticsearch deciding to rebuild several hundred gigabytes of replica traffic across the network.
While you’re here, remember why big recoveries look frozen: cluster.routing.allocation.node_concurrent_recoveries defaults to 2, node_initial_primaries_recoveries to 4, and indices.recovery.max_bytes_per_sec defaults to 40mb on most nodes. A 900 GB replica rebuild at 40 MB/s is roughly six and a half hours of legitimate, working recovery. Watch _cat/recovery?active_only=true and confirm bytes are moving before you conclude anything is stuck.
Red clusters: does a primary copy still exist?
When a primary is unassigned, the only question that matters is whether a usable copy of that data is still somewhere.
GET logs-app-2026.07.28/_shard_storesBy default this returns only shards with at least one unassigned copy, which makes it the right first call on a red index rather than a general health check. For each shard it lists which nodes hold a copy, the allocation_id, and any store_exception. A copy on a node currently offline shows up here. A copy with a corruption exception shows up here with the exception attached.
Checklist before you consider anything destructive:
- Is the node genuinely gone, or just unreachable — network partition, firewall change, a process that crashed but the data directory is intact? Power it on or fix the network. This solves the majority of red clusters.
- Is the data directory still present on that node’s disk? Check before you reimage anything.
- Is there a snapshot? Check the repository and the most recent successful snapshot timestamp for the index.
- Is the index rebuildable from source (reindex from a system of record, replay from Kafka)?
Exhaust all four before reading the next section.
The two commands that lose data
POST _cluster/reroute supports allocate_replica, allocate_stale_primary and allocate_empty_primary. The first is safe. The other two require accept_data_loss: true, and that flag exists because the API authors wanted you to type the words.
allocate_stale_primary promotes an out-of-date shard copy to primary. Every write made after that copy diverged from the real primary is gone. You keep the old data.
POST _cluster/reroute
{
  "commands": [
    {
      "allocate_stale_primary": {
        "index": "logs-app-2026.07.28",
        "shard": 0,
        "node": "es-data-02",
        "accept_data_loss": true
      }
    }
  ]
}
allocate_empty_primary creates a brand new empty primary shard. Everything that was in that shard is discarded permanently. It’s a data-loss command wearing an API’s clothing — the name sounds like routine housekeeping, and it’s closer to DROP than to anything you’d run casually.
POST _cluster/reroute
{
  "commands": [
    {
      "allocate_empty_primary": {
        "index": "logs-app-2026.07.28",
        "shard": 0,
        "node": "es-data-02",
        "accept_data_loss": true
      }
    }
  ]
}
Restore from snapshot first, always. Use allocate_stale_primary only when you’ve confirmed via _shard_stores that the stale copy is the best surviving copy and you understand roughly what window of writes you’re dropping. Use allocate_empty_primary only on rebuildable data such as logs or derived search indices, never on a system of record.
Whatever you run, write the exact index name, shard number and timestamp into the incident log immediately, while you still remember it. “Which shard did we nuke” is a bad question to be asking a week later during a postmortem.
The triage flow, on one card
GET _cluster/health— yellow or red? How many unassigned?GET _cat/recovery?active_only=true&v— is it already fixing itself? If bytes are moving, wait.GET _cat/shards?v&h=index,shard,prirep,state,unassigned.reason,unassigned.at,node&s=state— which shards, primaries or replicas, what event.GET _cluster/allocation/explainwith a targeted body — find the decider name.GET _cluster/settings?include_defaults=false&flat_settings=true— check for staleenable,exclude, filters.GET _cat/allocation?v— check disk if the decider wasdisk_threshold.- Apply the decider-specific fix from the table above.
- If the reason was
ALLOCATION_FAILED, runPOST _cluster/reroute?retry_failed=trueafter the fix, never before. - Watch
GET _cat/recovery?active_only=true&vuntil it drains, then re-check health. - Red only, and only after steps 1-9:
GET /_shard_stores, then the offline-node / data-directory / snapshot / rebuildable checklist, then and only then consider the destructive commands.
Prevention
- Alert on
cluster.statuschanging, and separately onunassigned_shards > 0sustained for more than 15 minutes. The sustained window filters out normal rolling-restart noise. - Watch disk usage trending toward 75-80%, not the moment it crosses the low watermark. By the time the low watermark fires you’re already allocating nothing new.
- Audit transient cluster settings after every maintenance window.
cluster.routing.allocation.enableback toall, exclusions removed, watermarks back to default if you touched them as a bridge. Put it in the maintenance checklist as a step with a checkbox. - Keep shard counts sane and stay well under
cluster.max_shards_per_node. Thousands of tiny daily indices is the most common self-inflicted wound on log clusters. - Test your snapshot restore. A snapshot you’ve never restored is a hypothesis.
- Raise
index.unassigned.node_left.delayed_timeoutbefore planned restarts and lower it afterwards.
Unassigned shards feel mysterious because the default reaction is to look at logs and dashboards, which describe symptoms. The allocation explain API describes the decision. Ask it first, and most of these incidents stop being incidents.